2026-03-11 05:00:00
Dive right into my Nasdaq technical analysis video from today (11 March, 2026)
The recent market action from investingLive.com suggests that while the “bearish tilt” felt heavy for a moment, the bulls might just be pulling a classic “fakie” recovery. Here is the fun recap of what went down:
1. Oracle’s Cloud Nine Moment
While the broader market was feeling the heat, Oracle smashed Q3 estimates, proving that the AI infrastructure build-out is still very much a thing.
-
The Flex: Revenue hit $17.19B, and Larry Ellison’s crew raised their total revenue outlook to a staggering $90B.
-
The Backlog: Their remaining performance obligations (RPO) ballooned to $553B—up from $130B just a year ago.
-
The Sentiment: This massive cloud growth is acting as a safety net for tech-heavy sentiment, keeping the AI dream alive even when the charts get shaky.
2. The Bearish Tilt: Technical Head-Fakes?
Just as things were looking sunny, technical analysts spotted a Nasdaq drop below the 100-hour Moving Average.
-
The Snag: The index hit a session high of 22,906 but got rejected right at the 200-hour moving average.
-
The Geopolitical Jab: News of potential mines in the Strait of Hormuz spooked traders, briefly shifting the control to the sellers.
-
The Verdict: Staying below 22,702 keeps things “tilted” to the downside, but the market seems to be fighting tooth and nail to keep that from becoming a full-blown slide.
3. The Great Rebound: Oil and Optimism
If the bearish tilt was a “fakie,” the Nasdaq rebound was the counter-punch.
-
The Catalyst: Oil prices cooled off after the G7 considered releasing emergency reserves.
-
The Trump Factor: Sentiment took a sharp turn for the better after Donald Trump suggested the war could end soon, leading traders to hunt for “dip-buying opportunities.”
-
What’s Next? With the US CPI report and Jobless Claims on the horizon, the market is caught between war headlines and economic data. Analysts are already whispering about a potential run back to all-time highs if de-escalation holds.
The takeaway? The bearish tilt was real, but thanks to Oracle’s cloud muscle and some geopolitical hopium, the “fakie” is currently in full effect. Keep an eye on that 200-hour MA; if we break it, the bears might officially be back in hibernation.
Nasdaq technical analysis today: Dip buyers defend support as bulls target 25,650
Nasdaq technical analysis today points to a market that is still leaning bullish after Monday’s sharp shakeout. Dip buyers stepped in quickly, reclaimed important territory, and pushed price back into a stronger position on the daily chart.
See the YouTube video here – Nasdaq technical analysis by Itai Levitan on investingLive.com Youtube Channel, March 11, 2026.
The first major feature on the chart is the yellow price channel. It is not perfectly clean, because markets often produce wicks and short-lived overshoots, but the overall structure still holds. The upper and lower boundaries continue to frame price action well, and there is also a midline inside the channel that has started to matter more. That middle area has already produced several reactions and now stands out as a near-term resistance zone.
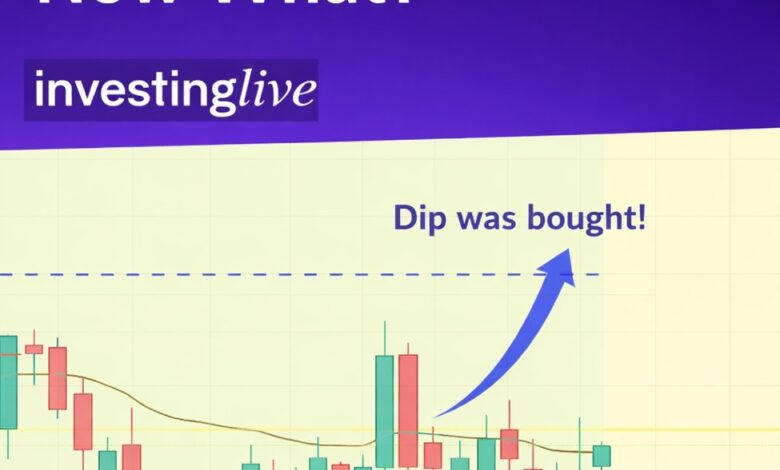
Nasdaq daily chart with my map after dip was bought
The second key tool is the volume profile, anchored from the contract rollover date. That matters because it helps identify where the market has done the most business during this phase. In simple terms, it highlights where buyers and sellers have found the most agreement on price.
The biggest node on that profile is the point of control, or POC, near 24,800. That is an important technical level because it represents the price area with the heaviest participation in this range. Right now, Nasdaq is trading above that POC, which is a constructive signal for bulls.
Price is also still inside the value area, marked by the two blue dotted lines. When a market is accepted back into value after a sharp dip, it often raises the probability of a move toward the upper end of that range. In this case, that puts roughly 25,650 into focus, along with the February 25 and February 26 highs.
That is one of the main reasons Monday’s dip deserves attention.
The market sold off sharply during the shakeout tied to oil-price volatility, but the weakness did not last long. Buyers came in quickly and pushed price back into the value area. That kind of response is more bullish than bearish, especially when it happens around important structure rather than in the middle of a random move.
Another level to watch is the 20-day exponential moving average, or EMA 20, which is now near 25,050. This is not as important as the POC, but it can still act as a useful short-term support reference. If Nasdaq keeps holding above that moving average, it gives bulls another layer of support beneath the market.
For traders looking for a stronger technical support level that may be less vulnerable to short-term noise, the POC around 24,800 remains the more important line on the chart.
Key Nasdaq levels to watch this week
On the upside, 25,650 is the area to watch. That is the upper part of value and also sits near recent highs that bulls may want to challenge.
On the downside, 25,050 is the first closer support via the EMA 20, while the 24,800 area is the more meaningful structural support through the POC.
As long as price remains above those areas and continues to hold inside the value area, the technical picture stays more supportive for bulls than bears.
Nasdaq outlook after the dip was bought
For now, the message from the daily chart is fairly straightforward. The dip was bought, value was reclaimed, and bulls still hold the stronger technical posture.
That does not guarantee an upside breakout this week. Markets can still stall, consolidate, or shake out weak hands again. But at this stage, the chart has not given bears enough evidence to confidently press the short side.
If Nasdaq continues to hold above the EMA 20 and the POC, a move toward 25,650 becomes increasingly realistic. If price starts getting rejected again and loses those support zones, then the rebound may need more time to repair before another meaningful push higher.
Follow investingLive.com for more Nasdaq technical analysis, market insights, and advanced order flow coverage. Trade at your own risk.