2026-03-04 19:34:00
The NZD/USD is trending higher today, but the recovery is now facing its most significant test of the week. The pair is currently squeezing into a dense pocket of overhead resistance that will determine if this move has “legs” or if it is simply a dead-cat bounce.
The Topside Hurdle: 0.5927 – 0.5940
The Kiwi is currently battling a two-tier resistance zone:
-
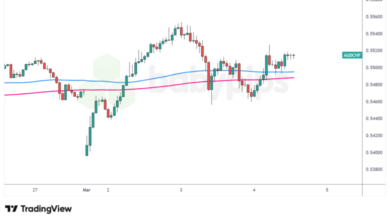
The Swing Area: Strong historical selling pressure exists between 0.5927 and 0.59355.
-
The Dynamic Ceiling: Just above that swing area sits the falling 100-hour Moving Average (MA) at 0.59403.
For the bullish bias to truly strengthen, the price needs a clean hourly close above this 0.5940 level. Until that happens, the bears still technically have the upper hand on the intraday charts.
The “If/Then” Scenarios
| Scenario | Technical Trigger | Price Target |
| Bullish Breakout | Sustained move above 0.5940 (100-hour MA) | Opens the door for a test of recent swing highs. |
| Bearish Rejection | Failure to clear the 0.5935 zone | A rotation back toward the 0.5900 handle (50% midpoint of the 2026 range). |
Summary & Video Breakdown
The 0.5900 level remains the psychological and technical “anchor” for the 2026 trading range. If buyers cannot reclaim the moving average here, expect a magnet-like pull back toward that midpoint.
In the video above, I dive deeper into these charts to show you exactly why these levels are dominating the current price action and how to define your risk against the 100-hour MA