Since it’s pretty clear we’ve now seen this cycle’s bull market high, I’ve created an updated halving-cycle model built on four Bitcoin cycles.
The model projects a cycle low near $35,000 in December 2026 after a 72.5% drawdown from a $126,219 cycle high.
Inside the halving-cycle framework
My last model correctly marked both the 2021 and 2025 top timeframes. The new framework, “Akiba Cycle Model v2,” combines a 50,000-run Monte Carlo simulation with walk-forward validation and leave-one-out cross-validation (LOOCV).
It breaks the cycle into three linked components: drawdown from a bull-market high to the subsequent cycle low, the number of days from a halving to that low, and the recovery multiple from the low into the next halving.
The drawdown and timing components produced smaller historical errors than the recovery leg. That recovery leg drove the largest miss in its out-of-sample test.
The model starts from an empirical pattern in prior cycles in which peak-to-trough drawdowns have eased each era while still remaining deep.
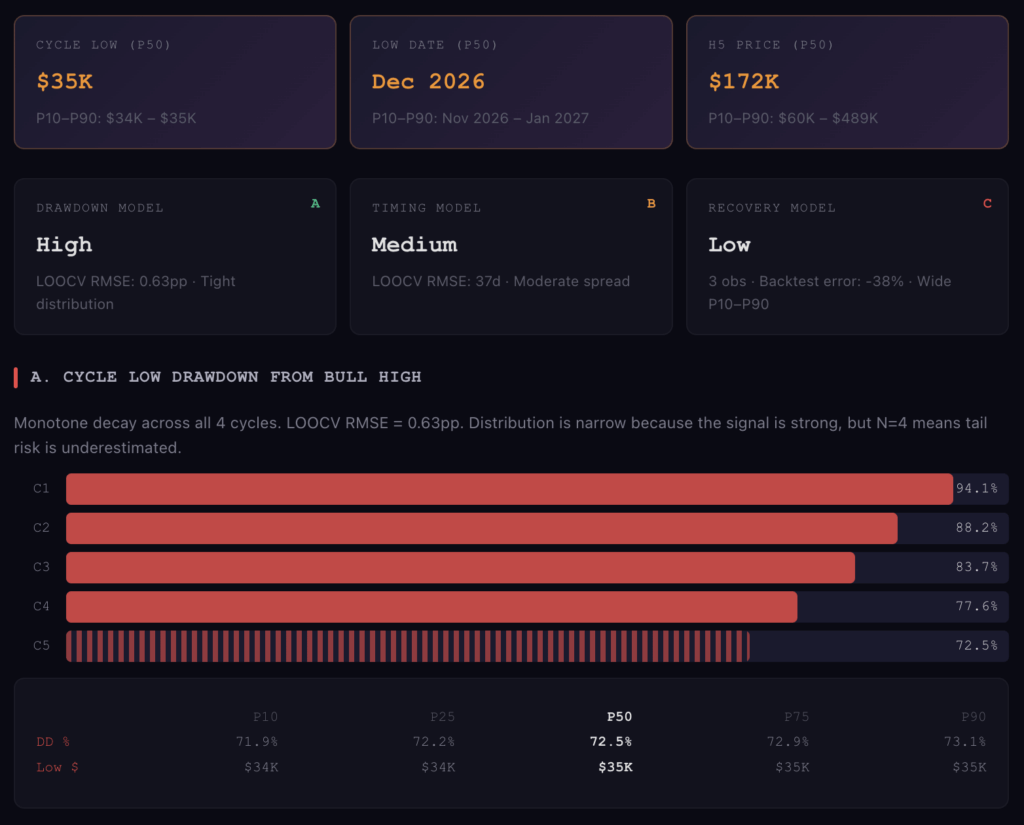
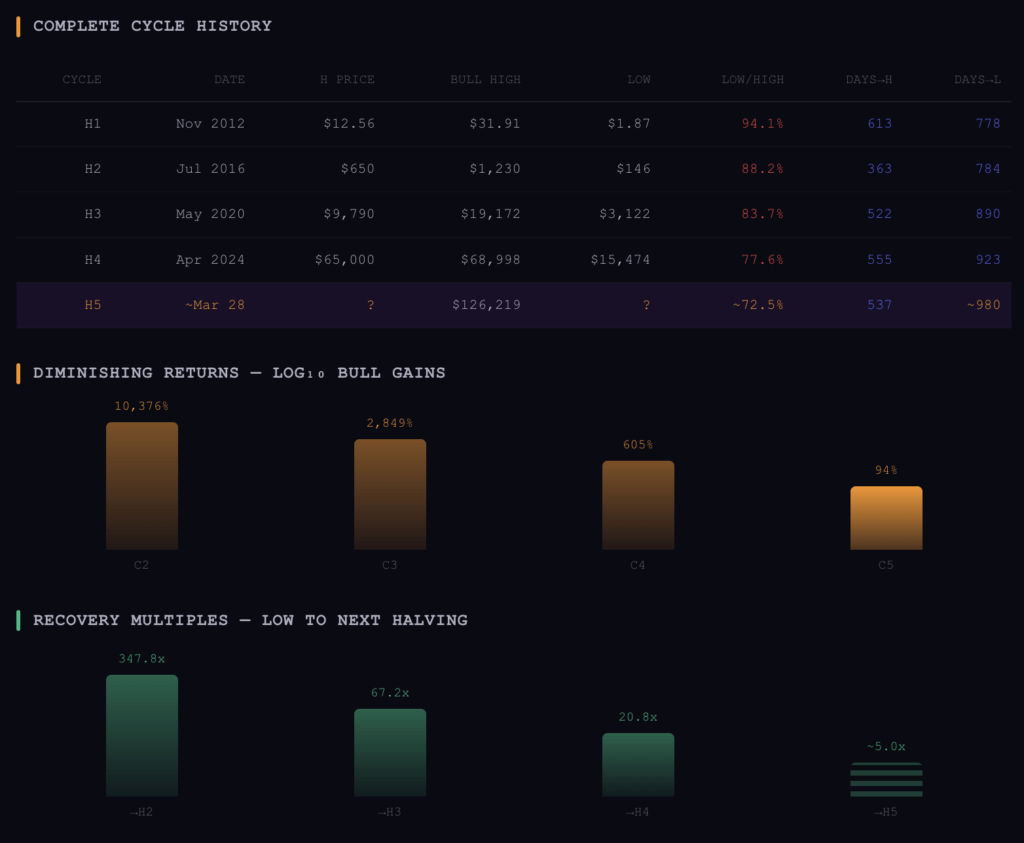
Historical drawdowns from the bull high to the cycle low were 94.1% in the first cycle, 88.2% in the second, 83.7% in the third, and 77.6% in the fourth, based on the cycle taxonomy used in the accompanying chart.
The fitted projection for the fifth cycle centers on a 72.5% drawdown, with a simulated band from 71.9–73.1%.
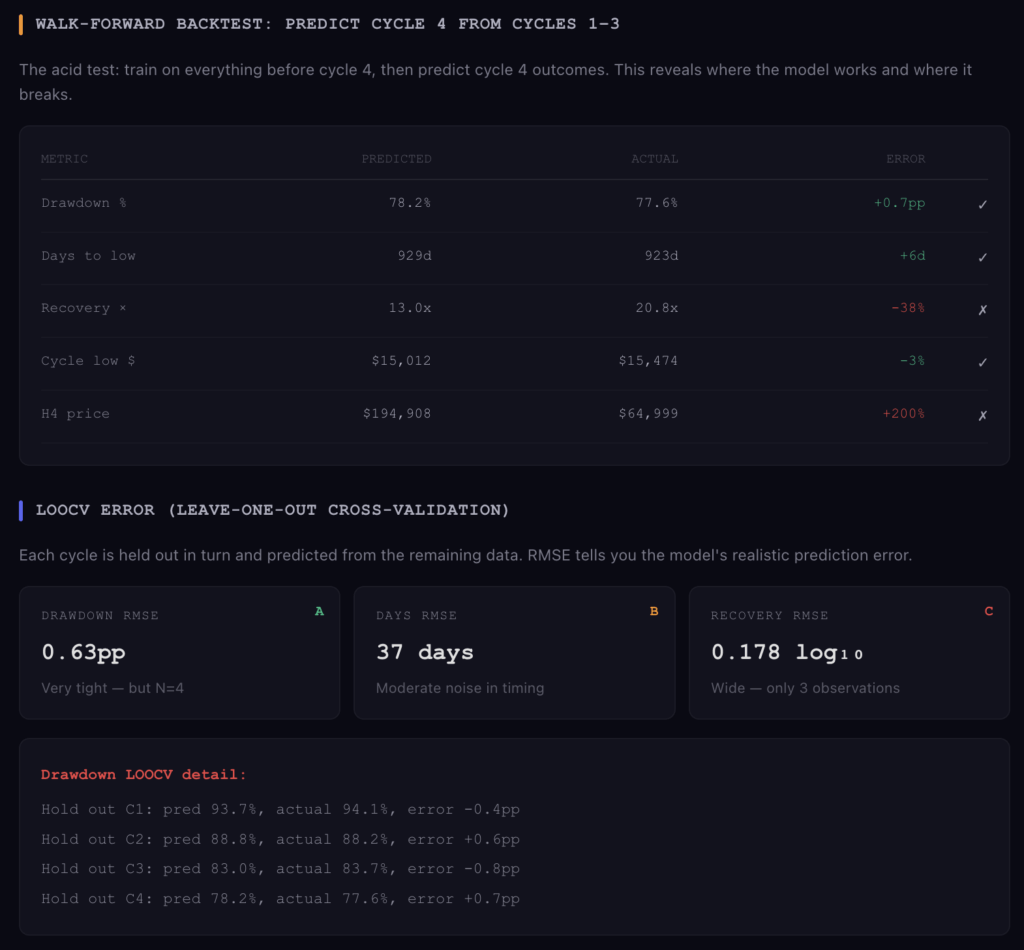
That drawdown distribution is tight because the monotone decay holds across all four observations. Its LOOCV root-mean-square error is 0.63 percentage points.
Using the bull-market high of $126,219, the implied cycle-low price distribution clusters around the mid-$30,000s.
The median simulated low is about $34,700, with a $33,900–$35,500 P10–P90 range.
Timing points to late 2026
I also mapped how long it takes the market to reach the cycle low after a halving.
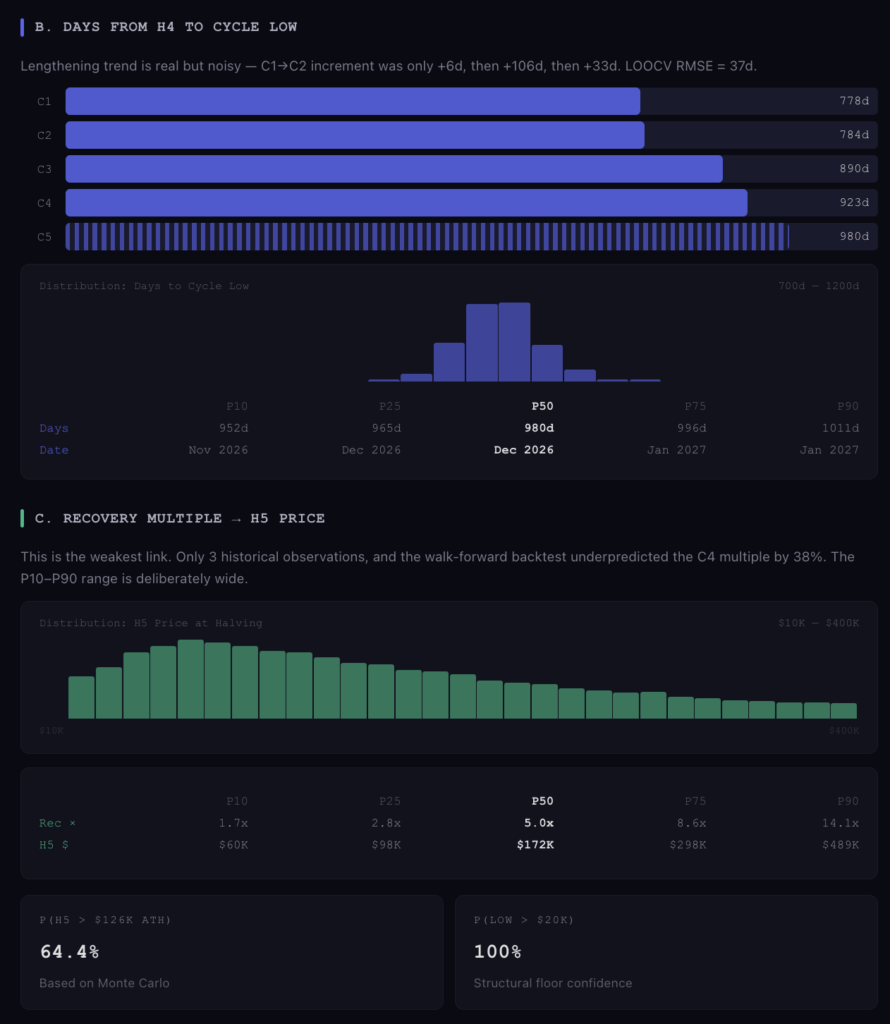
The days from halving to cycle low stepped from 778 days in cycle 1 to 784 days in cycle 2, then to 890 days in cycle 3 and 923 days in cycle 4.
The fifth-cycle estimate centers on 980 days after the April 2024 halving, which maps to December 2026. The P10–P90 window spans November 2026 through January 2027.
The LOOCV timing error is wider than drawdown, at 37 days. That reflects variance in the lengthening pattern, including the six-day increment between the first two cycles.
A condensed view of the cycle history used in the model is below.
| Cycle | Halving date | Halving price | Bull high | Cycle low | Low vs. high | Days to high | Days to low |
|---|---|---|---|---|---|---|---|
| H1 | Nov 2012 | $12.56 | $31.91 | $1.87 | 94.1% | 613 | 778 |
| H2 | Jul 2016 | $650 | $1,230 | $146 | 88.2% | 363 | 784 |
| H3 | May 2020 | $9,790 | $19,172 | $3,122 | 83.7% | 522 | 890 |
| H4 | Apr 2024 | $65,000 | $68,998 | $15,474 | 77.6% | 555 | 923 |
| H5 | Late Mar (est.) | ? | $126,219 | ? | ~72.5% | 537 | ~980 |
Recovery multiple drives the widest uncertainty
The recovery leg is the portion that the model treats as least stable. It estimates the multiple from a cycle low to the next halving price, a pathway that has compressed over time in the historical series.
The low-to-next-halving multiples were 347.8x into H2, 67.2x into H3, and 20.8x into H4, with a central estimate near 5.0x into H5.
Because that component has only three historical observations and failed its walk-forward test, the simulation uses a wide uncertainty band for the H5 halving price.
Its P10–P90 range runs from $60,000 to $489,000, with a median of $172,000.
I built and ran the backtest myself to pressure-test the model across prior cycles, making clear where its assumptions tracked reality, and where they began to break down. The backtest is explicit about where the approach held up.
Training on cycles 1 through 3 and predicting cycle 4, the model produced a 78.2% drawdown estimate, compared with an observed 77.6%, a 0.7 percentage-point gap.
It also projected 929 days to the cycle low versus an observed 923 days, a six-day gap.
In price terms, it projected a cycle low of $15,012 versus an observed $15,474, a 3% miss.
The same exercise underpredicted the recovery multiple by 38% (13.0x predicted versus 20.8x observed). That miss then propagated into a larger error on the implied halving price.
Those diagnostics shape how the outputs are presented.
The model treats the cycle-low estimate as the primary forecastable variable and frames the next-halving price as scenario space.
The Monte Carlo engine samples from an ensemble of simple functional forms (linear fits, exponential decay, and average-decrement variants), injects noise calibrated to LOOCV residuals, and uses jackknife resampling of the four-cycle dataset to stress sensitivity to any one era.
It also clamps outputs to bounds defined in the notes. It then chains the drawdown, timing, and recovery draws to produce a joint distribution.
A snapshot of the fifth-cycle distribution outputs is below.
| Output | P10 | P25 | P50 | P75 | P90 |
|---|---|---|---|---|---|
| Drawdown from bull high | 71.9% | 72.2% | 72.5% | 72.9% | 73.1% |
| Cycle low price | $34K | $34K | $35K | $35K | $35K |
| Days from H4 to cycle low | 952 | 965 | 980 | 996 | 1,011 |
| Cycle-low window | Nov 2026 | Dec 2026 | Dec 2026 | Jan 2027 | Jan 2027 |
| H5 halving price | $60K | $98K | $172K | $298K | $489K |
The notes also include two probability statements derived from the simulated distribution set: a 64.4% chance that the H5 halving price exceeds $126,219, and a 100% chance that the cycle low stays above $20,000 under the model’s structural floor assumptions.
Both claims are conditional on the model design, including its small-sample calibration and its independence assumption. That assumption treats drawdown, timing, and recovery as separable random draws even though they can co-move.
The observations underpinning the cycle taxonomy help explain why the model focuses on drawdowns and elapsed time rather than peak returns.
Peak gains relative to the prior halving price have compressed each era, moving from 10,375% in cycle 2 to about 2,900% in cycle 3 and 632% in cycle 4.
In the notes, the current cycle’s bull high is set at 103% over the prior halving price.
At the same time, the halving-to-high interval lengthened from 363 days after the first halving to 522 days after the second and 555 days after the third.
Under the chosen data points, the model places the fifth-cycle bull-market high at 537 days after the April 2024 halving.
The model documentation lists several limitations that can change how these distributions should be read.
It uses four cycles in total, so its tails can understate outcomes outside the historical range.
It also does not account for regime variables such as ETF flow patterns, custody structure, or macro correlation inputs like rates and liquidity.
The recovery module is flagged as the main source of uncertainty, since the walk-forward test showed that cycle-shape extrapolation did not capture the cycle 4 recovery multiple.
For market participants who treat halving-era behavior as a repeatable template, the v2 framework formalizes two prior-cycle regularities: a drifting drawdown rate and a lengthening path to the cycle low.
It leaves the next-halving price as a wide distribution rather than a point call.
The model’s median path places the next cycle low in the mid-$30,000s around December 2026. It leaves the halving-5 price as an outcome band anchored at $172,000 in the middle of a $60,000 to $489,000 range, with the caveat in the notes that it is not financial advice.
At the time of press 3:57 pm UTC on Feb. 27, 2026, Bitcoin is ranked #1 by market cap and the price is down 1.67% over the past 24 hours. Bitcoin has a market capitalization of $1.32 trillion with a 24-hour trading volume of $43.14 billion. Learn more about Bitcoin ›
Crypto Market SummaryAt the time of press 3:57 pm UTC on Feb. 27, 2026, the total crypto market is valued at at $2.28 trillion with a 24-hour volume of $104.05 billion. Bitcoin dominance is currently at 58.00%. Learn more about the crypto market ›