TA Alert of the Day: CAD/JPY MACD Reclaims the Zero Line and Eyes Bullish Follow Through
2026-02-26 22:44:00
CAD/JPY is flashing a classic momentum “regime change” type of alert as the MACD pushes back into positive territory.
Even though the latest daily candle closed slightly lower, the underlying momentum measure has improved enough to trigger a notable threshold.
This kind of signal often grabs attention because it can show up early in a transition from recovery to trend follow-through.
The next few sessions matter most for whether momentum can translate into sustained price acceptance above nearby levels.
Welcome to “TA Alert of the Day.” Each day after the market close, MarketMilk scans for popular technical indicator alerts. We use these alerts as the basis for a mini-lesson, breaking down what each alert means, why it matters, and how traders might interpret it. The goal is to help beginner traders not only spot these alerts but also understand the logic behind them and how they can inform trading decisions.
What MarketMilk Has Detected
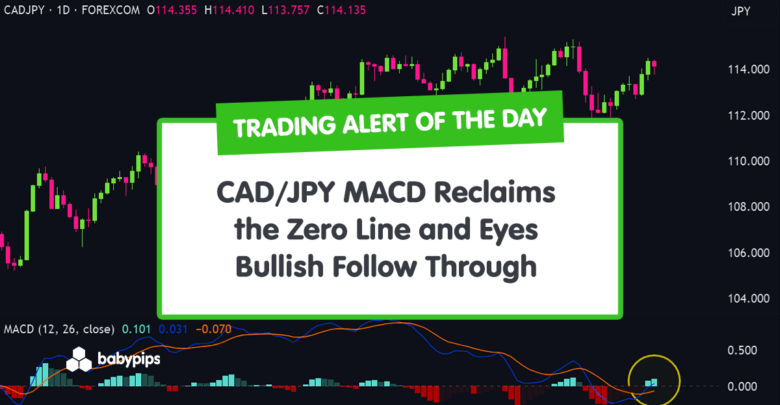
On the daily (1d) chart, MACD(12,26,9) has crossed above the zero line, with the MACD reading rising to approximately 0.02 (from negative territory).
This suggests momentum is attempting to shift back bullish.
As shown on the chart, CAD/JPY slid from the early-January area near 114.90–115.43 down into mid-February lows around 112.13, then rebounded back toward the 114.37–114.51 zone.
The current close near 114.11 sits below recent resistance around 114.37–114.50, while nearby support is visible around 113.75–113.80 (recent intraday lows) and then the more structural zone near 112.90–112.50.
What This Signals
The traditional read of a MACD zero-line cross to the upside is that momentum is shifting in favor of buyers, and it can attract trend-following interest if the move is sustained.
This threshold acts like a filter between bearish and bullish momentum regimes, so holding above it can matter as much as the initial cross.
However, this same pattern can also represent a late confirmation after a rebound has already occurred.
When price is still capped by nearby resistance (here, the 114.37–114.50 area), zero-line crosses sometimes coincide with where prices briefly push higher and then roll over—especially if momentum cools quickly and the MACD slips back toward (or below) zero.
Alternatively, the signal can function as a mean-reversion handoff: the February rebound off the 112.13 low may be transitioning into a broader range rotation rather than a clean trend.
In that scenario, MACD can hover around zero and generate choppy follow-through while price oscillates between established support and resistance.
The outcome depends heavily on follow-through price action, the market’s ability to hold above reclaimed levels, and whether momentum remains constructive while CAD/JPY confronts the 114.37–115.00 supply zone.
Context and confirmation are essential, particularly because the latest candle closed down on the day even as the indicator improved.
How It Works
MACD (12,26,9) measures momentum by comparing two exponential moving averages (EMAs): the 12-period EMA minus the 26-period EMA forms the MACD line, and a 9-period EMA of that value forms the signal line.
The zero line is a key reference point: above zero implies the shorter EMA is above the longer EMA (a bullish momentum tilt), while below zero implies the opposite.
The MACD histogram reflects the distance between the MACD line and the signal line, which can help traders gauge whether momentum is accelerating or decelerating.
In this dataset, the MACD line has recovered from negative readings in mid-February to slightly positive now, aligning with the rebound from the 112.13 area back toward the mid-114s.
Important: MACD is a lagging indicator since it confirms a momentum shift after price has already moved. Zero-line crosses can be prone to whipsaws when the market is ranging, so combining the signal with clear price acceptance above resistance (and avoiding “one-bar” flips back below zero) typically improves reliability.
What to Look For Before Acting
Do not assume the uptrend will continue. Consider these factors:
✅ A daily close back above 114.37–114.50 (recent resistance) to confirm price acceptance, not just indicator improvement
✅ Whether pullbacks hold above 113.75–113.80 (near-term support from the latest session’s low area)
✅ A successful retest of the 114.00 area as support after any breakout attempt
✅ MACD staying above the zero line for several sessions (reduces “pop-and-drop” risk)
✅ Improvement in recent swing structure (higher highs and higher lows) versus the February sequence
✅ Confluence with the 4-Hour or Weekly chart trend context (higher timeframe alignment, since this is a daily signal)
✅ Price behavior near 115.00–115.43 (prior peak/supply zone): rejection vs acceptance can define the next phase
✅ Event risk and rate-sensitive drivers (e.g., upcoming central bank commentary/data that can affect CAD and JPY volatility)
Risk Considerations
⚠️ Whipsaw risk: MACD zero-line crosses can fail quickly in range conditions, flipping back below zero
⚠️ Overbought momentum risk: momentum can look “stretched” even without a clean breakout, increasing pullback odds
⚠️ Nearby resistance overhead at 114.37–114.50 and again near 115.00–115.43, which can cap follow-through
⚠️ Volatility risk around macro releases impacting CAD or JPY, which can invalidate technical levels quickly
Potential Next Steps
CADJPY remains in a broader uptrend, but recent price action has shifted into consolidation just below prior highs. Momentum is attempting to turn higher again after a pullback, and MACD is curling up and breached the zero line, suggesting early bullish rebuilding.
Keep CAD/JPY on a watchlist for how it behaves around 114.37–114.50: sustained closes above that zone would better align price action with the bullish MACD regime shift.
If price remains rejected there, consider waiting for either a cleaner breakout-and-retest or a pullback that holds 114.00 (or at least 113.75–113.80) while MACD remains above zero.
In either case, position sizing and predefined exit levels matter because failed zero-line crosses can revert quickly when the market rotates back into a range.
Trade Idea (Bullish Breakout Scenario)
Setup:
Look for continuation higher if price can break and hold above 114.70–115.00, confirming a fresh higher high.
Entry:
Enter long on a daily close above 115.00. Or enter on a controlled pullback that holds above 113.20 after a breakout.
If price fails at 115.00 and prints a strong rejection candle, stand aside and reassess for a pullback trade.
Stop Loss:
For breakout entries: stop on a daily close back below 113.80 (invalidation = breakout failure and return into range).
For pullback entries: stop on a daily close below 112.00 (invalidation = structure breakdown).
Take Profit:
First target: 119.00.
Second target: Trail stop if upside momentum expands.
Bottom line:
CADJPY is coiling just below resistance. A confirmed break above 115.00 favors trend continuation, while failure at that level increases the probability of a pullback toward 112–113.
Trade Idea (Bearish Pullback Scenario)
Setup:
Look for a rejection at 114.70–115.00, especially if price prints a bearish daily candle and MACD rolls back down from the zero line.
Entry:
Enter short on a daily close back below 113.80 following rejection from resistance.
If price holds above 115.00 instead, stand aside — that invalidates the short idea.
Stop Loss:
Stop on a daily close above 115.30 (invalidation = breakout confirmed).
Take Profit:
First target: 112.00.
Second target: 110.00 if downside momentum builds.
Bottom line:
CADJPY is at a clear decision point. Above 115.00 confirms continuation of the broader uptrend. Rejection below that level keeps the pair range-bound and opens room for a corrective move back toward 112.
This content is strictly for informational purposes only and does not constitute as investment advice. Trading any financial market involves risk. Please read our Risk Disclosure to make sure you understand the risks involved.