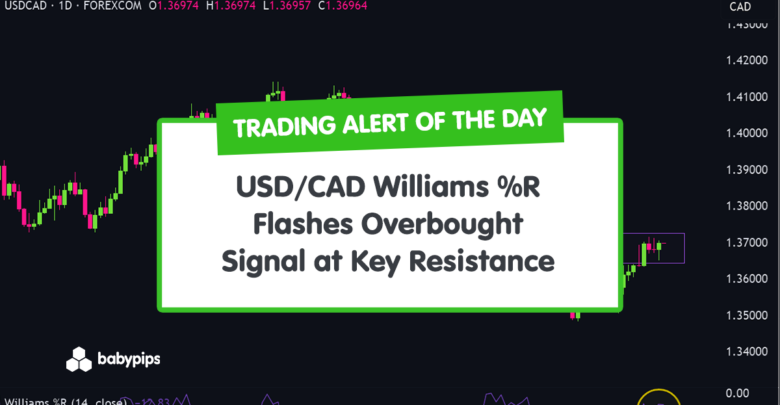
TA Alert of the Day: USD/CAD Williams %R Flashes Overbought Signal at Key Resistance
2026-02-23 22:27:00
USD/CAD is pressing back toward a well-watched price zone after a sharp rebound from early-February lows.
A momentum oscillator has now moved into overbought territory, signaling stretched short-term conditions.
In a prevailing bearish structure, that type of reading can increase the risk of downside continuation. The reaction here may determine whether sellers step back in or if price can squeeze higher against the trend.
Welcome to “TA Alert of the Day.” Each day after the market close, MarketMilk scans for popular technical indicator alerts. We use these alerts as the basis for a mini-lesson, breaking down what each alert means, why it matters, and how traders might interpret it. The goal is to help beginner traders not only spot these alerts but also understand the logic behind them and how they can inform trading decisions.
What MarketMilk Has Detected
Williams %R (14) has moved into overbought momentum, rising to -12.60 and crossing above the -20 threshold.
This occurs as USD/CAD closes at 1.369705, rebuilding upside pressure after the swing low near 1.3490 (2026-01-28).
Based on the chart, price has repeatedly reacted around the 1.3700–1.3725 area (multiple closes and highs in late-Dec through early-Feb), making the current push into that region technically notable as momentum heats up.
What This Signals
Traditionally, a Williams %R move above -20 can attract mean-reversion attention, as it often marks stretched short-term upside momentum.
If the move is sustained near resistance (such as 1.3700–1.3725), it can coincide with a pause, rotation, or pullback toward nearer supports.
However, this same pattern can also represent trend strength, where prices briefly “stick” in overbought momentum during a grind higher.
In that case, Williams %R can remain elevated while USD/CAD continues to probe above resistance—sometimes producing premature short signals if traders act on the oscillator alone.
The outcome depends heavily on follow-through in price action, the behavior around the 1.3700–1.3725 resistance band, and whether momentum cools without price breaking structure. Context and confirmation are essential.
How It Works
Williams %R is a momentum oscillator that compares the close to the recent high-low range (here, the last 14 sessions).
It oscillates between 0 (near the highest closes of the lookback window) and -100 (near the lowest closes).
Readings above -20 are commonly treated as overbought momentum, while readings below -80 are treated as oversold momentum.
Important: Overbought momentum does not mean price is “overvalued,” and it does not guarantee a reversal. In strong directional moves, Williams %R can stay in overbought territory for multiple sessions, so confirmation from price structure and nearby levels tends to matter more than the threshold crossing itself.
What to Look For Before Acting
Do not assume an immediate downside reversal. Consider these factors:
✅ Whether USD/CAD rejects the 1.3700–1.3725 area (e.g., long upper wicks, failed daily closes above that zone)
✅ A Williams %R exit back below -20 alongside weakening daily closes (momentum cooling with price confirmation)
✅ Presence of a lower high / lower low sequence on the daily chart after the signal
✅ Whether former reaction zones act as support: 1.3680–1.3660 (recent congestion) and then 1.3620–1.3600 (cluster of closes mid-Feb)
✅ If price instead breaks and holds above 1.3725, treat the signal as a “momentum is strong” regime rather than a reversal cue
✅ Confirmation from a higher timeframe: check the Weekly chart for alignment (range vs trend, and where price sits relative to broader swing levels)
✅ Event risk that can overwhelm oscillator signals (e.g., upcoming BoC/Fed messaging, CPI/jobs data, oil-driven CAD sensitivity)
Risk Considerations
⚠️ Overbought persistence: Williams %R can remain above -20 while price continues higher, creating early/false bearish reads
⚠️ Resistance breakout risk: A clean hold above 1.3700–1.3725 can flip the area into support and invalidate mean-reversion expectations
⚠️ Whipsaw near the threshold: Small moves can push %R above/below -20 repeatedly, especially in choppy conditions
⚠️ Headline volatility: FX can reprice quickly on macro surprises, overpowering oscillator-based timing
Potential Next Steps
USDCAD remains structurally weak despite recent consolidation. The broader trend has shifted lower from the 1.4100 highs, and the current range appears more like a pause within a downtrend rather than a reversal.
Until price breaks and holds above 1.3800, the broader structure favors continuation lower.
Keep USD/CAD on a watchlist as it tests the 1.3700–1.3725 region with Williams %R in overbought momentum.
You may prefer to wait for confirmation, such as a failure to hold above resistance, a momentum rollover back below -20, or a clear break of nearby supports, before treating the signal as actionable.
If you do trade this, consider defining risk around invalidation (e.g., a sustained hold above resistance) and sizing appropriately for event-driven FX volatility.
Trade Idea (Range Rejection or Breakdown)
Setup:
Favor short positions as long as USDCAD remains below 1.3750–1.3800, maintaining the broader bearish structure.
Entry Option 1 – Range Rejection:
Look for bearish rejection near 1.3720–1.3750 and enter short on a daily close back below 1.3680, confirming sellers are defending range highs.
Entry Option 2 – Breakdown:
Enter short on a decisive daily close below 1.3600, signaling range resolution to the downside.
If price closes decisively above 1.3800, stand aside. This would invalidate the bearish structure and increase the probability of a larger trend reversal.
Stop Loss:
Place the stop on a daily close above 1.3800.
Take Profit:
First target: 1.3500–1.3550.
Secondary target: 1.3400 if downside momentum expands.
Bottom line:
USDCAD remains structurally bearish following the decline from 1.4100. The current consolidation appears corrective. As long as price holds below 1.3800, rallies favor selling, and a break below 1.3600 would likely trigger the next leg lower.
This content is strictly for informational purposes only and does not constitute as investment advice. Trading any financial market involves risk. Please read our Risk Disclosure to make sure you understand the risks involved.