The potential US-Iran war is a major risk for the Nasdaq; weekend risk to cap gains

2026-02-19 10:34:00
FUNDAMENTAL
OVERVIEW
The Nasdaq failed to rally
on the slightly soft US CPI report last Friday and continued to range. We now
have another major risk for the market as a potential US-Iran war could trigger
a big selloff. In fact, we got a report from
Axios yesterday
suggesting that a war between the U.S. and Iran now appears increasingly
likely. According to the sources cited, there is currently no sign of a
diplomatic breakthrough between Washington and Tehran, which is irritating
Trump.
They also noted that, given
Trump’s recent military build-up and escalated rhetoric, it may be difficult
for him to de-escalate without Iran offering significant concessions on its
nuclear program. The report added that any military operation in Iran would be
massive, involving a weeks-long campaign that would resemble a full-fledged
war.
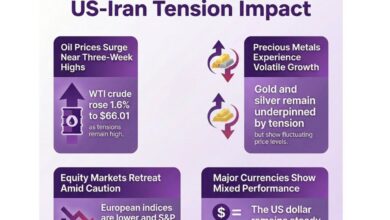
If a military conflict were
to break out, we would see oil prices skyrocket due to the risk of disruption
in the Strait of Hormuz, especially in light of the recent military drills. This
would be a negative shock for the global economy and lead to stagflation risks.
The first reaction in the markets would be strong risk aversion. We would
highly likely see a huge selloff in the stock market as future growth
expectations would turn negative.
Another important event is tomorrow’s
potential US Supreme Court decision on Trump’s tariffs. In fact, if the Supreme
Court were to rule against the tariffs, we will likely see the stock market rallying
on positive growth expectations but the weekend risk around Iran could keep a
lid on gains. Traders will likely err on the cautious side heading into the
weekend.
NASDAQ TECHNICAL
ANALYSIS – DAILY TIMEFRAME
Nasdaq – daily
On
the daily chart, we can see the
Nasdaq has been trading in a wide range
since October of last year. Such long consolidations generally lead to big trending
moves once the price breaks out. Until then, the market participants will
continue to play the range.
NASDAQ TECHNICAL
ANALYSIS – 4 HOUR TIMEFRAME
Nasdaq – 4 hour
On
the 4 hour chart, we can see a
downward trendline defining the bearish momentum. The sellers continue to lean
on the trendline with a defined risk above it to keep pushing into new lows. The
buyers, on the other hand, will want to see the break higher to pile in for a
rally into the 25,400 level next.
NASDAQ TECHNICAL
ANALYSIS – 1 HOUR TIMEFRAME
Nasdaq – 1 hour
On the 1 hour chart, there’s
not much we can add here but the most recent higher low around the 24,750 level
defines the bullish structure on this timeframe. If the price falls to that
level, we can expect the dip-buyers to step in with a defined risk below the
level to target a break above the downward trendline. The sellers, on the other
hand, will look for a break lower to increase the bearish bets into the
February lows next. The red lines define the average daily range for today.
UPCOMING CATALYSTS
Today we get the latest US Jobless Claims figures. Tomorrow, we conclude the
week with the US Q4 GDP, the US PCE price index for December, the US Flash PMIs
and a potential US Supreme Court decision on Trump’s tariffs. Watch out for
US-Iran headlines as well.