Bitcoin rocketed 15% to get back above $70,000 but the options market is currently pricing in a terrifying new floor

Bitcoin ripped from $60,000 to above $70,000 in less than 24 hours, erasing most of a brutal 14% drawdown that had tested every bottom-calling thesis in the market.
The speed of the reversal, 12% in a single session and 17% off the intraday low, was violent enough to feel like a capitulation resolved. Yet, the mechanics beneath the bounce tell a different story: this was cross-asset stabilization meeting forced-position rebalancing, not a flood of conviction-driven spot demand.
And the derivatives market, still crowded into downside protection, is pricing the possibility that $70,000 becomes a pause rather than a floor.
Forced unwinds met macro stress
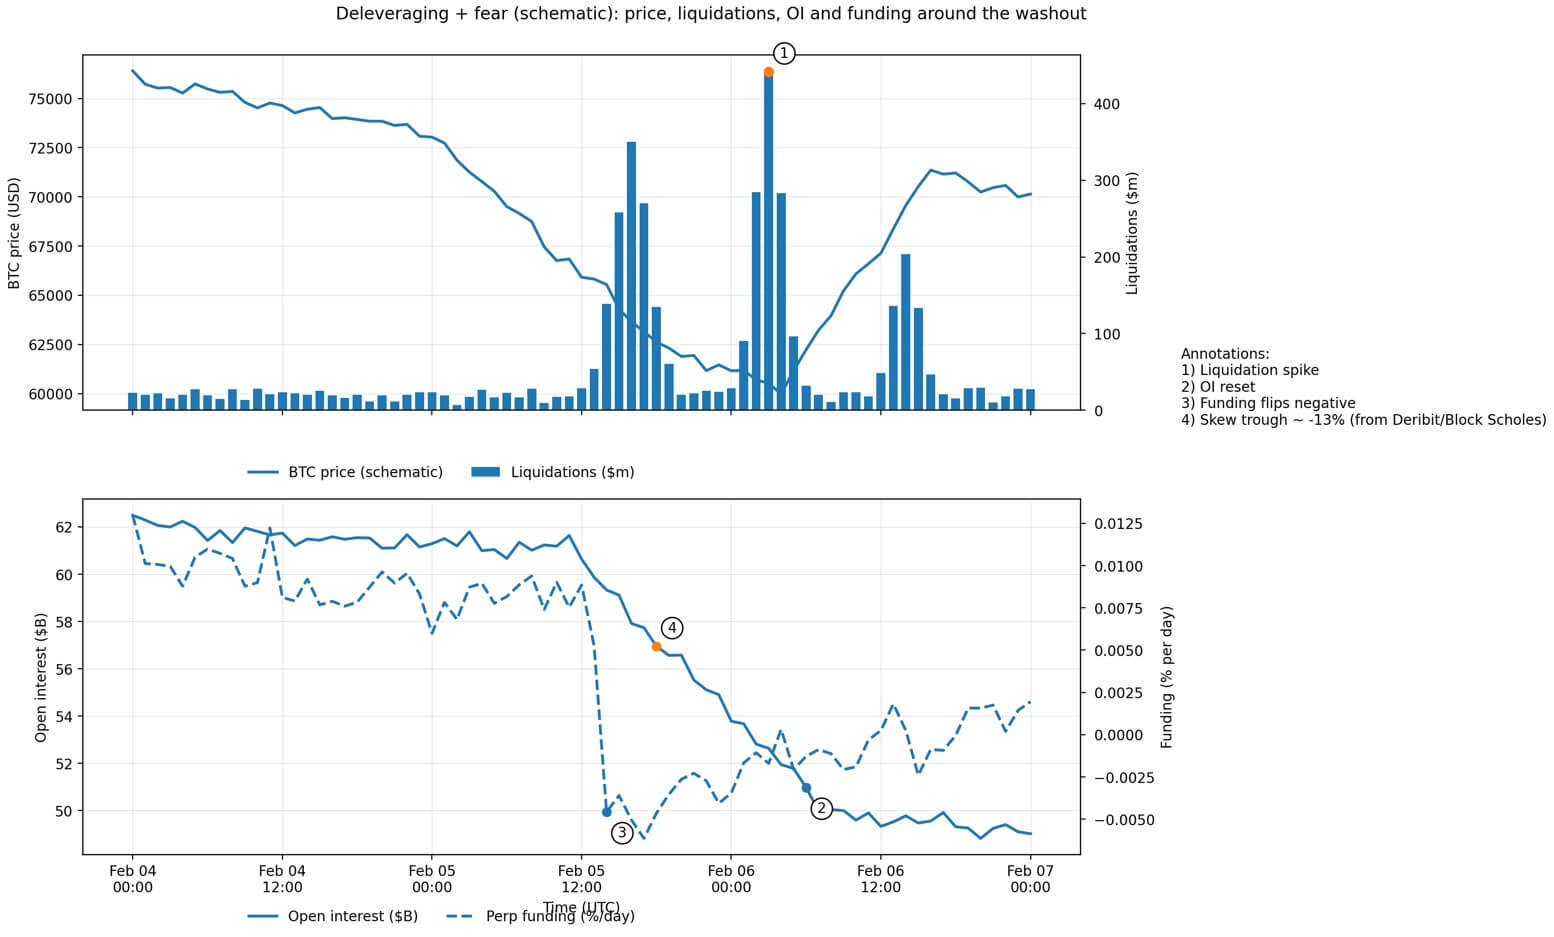
Feb. 5 opened near $73,100, traded briefly higher, then collapsed to $62,600 by close, a one-day decline that liquidated approximately $1 billion in leveraged Bitcoin positions, according to CoinGlass data.
That figure alone captures the forced-selling cascade, but the broader picture was worse.
Open interest in BTC futures fell from roughly $61 billion to $49 billion over the prior week, according to CoinGlass, meaning the market had already been shedding leverage when the final flush hit.
The trigger wasn’t crypto-specific. Reports framed the selloff as a weakening of risk sentiment, driven by tech-stock selling and a volatility shock in precious metals, with silver declining by as much as 18% to around $72.21, dragging down correlated risk assets.
Deribit research confirmed the spillover, noting that derivatives sentiment turned extremely bearish, with funding rates negative, inverted implied volatility term structures, and a 25-delta risk-reversal skew crushed to approximately -13%.
These are classic “crowded fear” conditions in which positioning amplifies price moves in both directions.
A policy narrative added fuel. Reuters reported market reaction to President Donald Trump’s selection of Kevin Warsh for Federal Reserve chair, with traders interpreting the choice as signaling balance-sheet contraction and tighter liquidity conditions ahead.
Meanwhile, miners faced acute margin pressure. TheMinerMag reported that hash price fell below $32 per petahash per second, with network difficulty projected to drop roughly 13.37% within two days. This relief valve wouldn’t arrive until after the price had already broken support.
Macro reversal plus squeeze mechanics
Feb. 6 opened where Feb. 5 closed, dropped to an intraday low near $60,000, then ripped to a high around $71,422, which it failed to breach three times before dropping back below $70,000.
The catalyst wasn’t internal to crypto, but a sharp reversal in the cross-asset tape. Wall Street surged: the S&P 500 up 1.97%, Nasdaq up 2.18%, Dow up 2.47%, and the SOX semiconductor index up 5.7%.
Metals snapped back hard, with gold up 3.9% and silver up 8.6%, while the dollar index fell 0.2%, signaling a looser financial conditions impulse.
Bitcoin moved mechanically with that shift. The correlation isn’t subtle: when tech stabilizes and metals rebound, BTC gets pulled along via shared risk exposure.
However, the violence of the snapback also reflects the derivatives’ positioning. Skew near -13%, negative funding, and inverted volatility structures create conditions where any macro relief can trigger short-covering and forced rebalancing.
The rebound was driven by a liquidity event, amplified by the unwinding of crowded short positions.
Nevertheless, the forward-looking signal remains bearish. Derive data showing heavy put open interest concentrated at $60,000-$50,000 strike prices for the Feb. 27 expiry.
Derive’s Sean Dawson told Reuters that the downside demand is “extreme.” That’s not hindsight analysis, but traders explicitly hedging for another leg lower, even after the bounce.
Can $70k hold? The framework
The case for holding above $70,000 rests on three conditions.
First, the macroeconomic rebound needs to persist, with technology continuing to stabilize, yields not re-tightening, and the dollar not re-tightening.
The bounce was explicitly cross-asset. If equities roll over again, BTC won’t decouple.
Second, leverage needs to continue to cool without fresh forced selling. Open interest has already dropped hard, reducing air-pocket risk.
Third, miner stress needs real relief when the difficulty adjustment lands.
If price holds within that window, the projected 13.37% drop could reduce marginal selling pressure and allow hashrate to stabilize.
The case for another shakeout has three legs.
First, options positioning remains skewed toward the downside. The largest put concentration is at $60,000-$50,000 in late February, a forward-looking signal embedded in market-implied probabilities rather than backward-looking sentiment.
Second, derivatives signals remain fragile. Skew near extremes, recently negative funding, and inverted volatility structures are consistent with a relief rally inside a fear regime rather than a trend reversal.
Third, ETF flow data show persistent outflows. Bitcoin ETFs registered $690 million in monthly net outflows as of Feb. 5.
Although the Feb. 6 results are not yet available, the pattern suggests institutional allocators haven’t shifted from de-risking to re-engagement.
| Signal bucket | Metric | Latest reading / regime (as of press time) | Bullish confirmation (what change you need) | Bearish continuation (what to fear) | Source |
|---|---|---|---|---|---|
| Derivatives | Perp funding rate | Negative (below 0%) — “extreme bearishness” regime | Funding flips positive and stays positive across major venues (not just a 1–2 hour blip) | Funding stays negative / whipsaws while price chops → “relief rally” risk | Deribit Insights / Block Scholes, Week 6 (funding below 0%; BTC funding negative) |
| Options risk | 25D risk reversal (skew) | Short-dated skew as low as ~ -13% (put demand surge) | Skew rebounds toward 0 (less demand for downside protection) and holds | Skew remains deeply negative (persistent protection bid) | Deribit Insights / Block Scholes, Week 6 (25D RR “as low as -13%”) |
| Leverage | Futures open interest (OI) | Deleveraging / OI falling (forced liquidation phase); recent reporting highlights ~$55B equivalent OI exiting in 30 days | OI stabilizes (no rapid re-leveraging) while price holds >$70K | OI rebuilds quickly into rallies → higher odds of another liquidation leg | Glassnode: forced deleveraging + long liquidation spikes |
| Flows | Spot BTC ETF net flows (daily/weekly) | Net outflows: Feb 4 – $544.9m, Feb 5 – $434.1m; Feb 6 not yet posted on the tape | Outflows decelerate to flat, then modest inflows (even “less negative” helps in thin liquidity) | Outflows accelerate (more -$400m to -$500m days) → repeated shakeout risk | Farside Investors daily ETF flow table |
| On-chain stress | Realized losses (7D avg) | > $1.26B/day (7D SMA) — capitulation/forced selling still elevated | Realized losses peak then trend down while price holds the $70K area (seller exhaustion) | Losses stay elevated or rise into bounces → distribution, not accumulation | Glassnode Week On-chain Week 05 (“7D SMA … above $1.26B per day”) |
| Mining | Hashprice + next difficulty adjustment | Hashprice < $32/PH/s (record low); difficulty projected -13.37% next adjustment (~2 days) | Difficulty relief arrives and hashrate stabilizes (reduced miner stress/sell pressure) while BTC holds >$70K | Hashprice falls further / hashrate drops more → miner selling/treasury drawdowns increase | TheMinerMag (hashprice < $32/PH/s; difficulty proj. -13.37%) |
What $70k actually means
The level itself isn’t magical. The significance lies in its position above Glassnode’s identified on-chain absorption cluster between $66,900 and $70,600.
Holding above $70,000 would suggest that the cluster absorbed enough supply to stabilize price action, at least temporarily. Yet, holding requires more than technical support. It requires spot demand returning while derivatives hedging unwinds and institutional flows stabilize.
The rebound off $60,000 was real, but its composition matters. Cross-asset stabilization can reverse if macro conditions shift.
Forced-position unwinding creates mechanical bounces that don’t necessarily translate into sustained trends. And options traders are still pricing a meaningful probability of a move toward $50,000-$60,000 over the next three weeks.
Bitcoin reclaimed $70,000, but it is already consolidating below that level, suggesting a pause before another test in which three conditions must occur sequentially: macro risk appetite holding, ETF outflows decelerating or reversing, and derivatives sentiment normalizing beyond short-term relief.
The market delivered a violent snapback, but the forward curve and flow data suggest traders aren’t yet betting on durability. The $70,000 level isn’t the endgame, it’s just the level where the next phase of the argument gets decided.