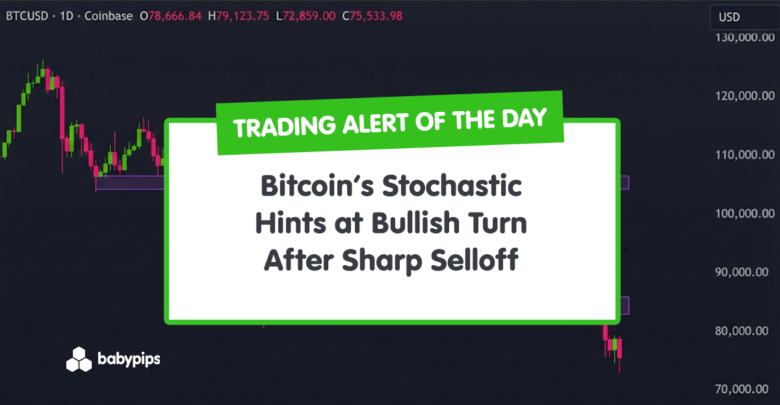
TA Alert of the Day: Bitcoin’s Stochastic Hints at Bullish Turn After Sharp Selloff
2026-02-03 22:52:00
BTC/USD has slipped hard in recent sessions, but momentum is starting to hint that selling pressure may be losing some intensity.
After a sharp drop into a prior reaction zone, the latest Stochastic crossover is flashing a classic “oversold bounce” setup worth monitoring.
This is not a green light by itself, but it does flag that conditions are changing beneath the surface, often before price action becomes obvious.
Welcome to “TA Alert of the Day.” Each day after the market close, MarketMilk scans for popular technical indicator alerts. We use these alerts as the basis for a mini-lesson, breaking down what each alert means, why it matters, and how traders might interpret it. The goal is to help beginner traders not only spot these alerts but also understand the logic behind them and how they can inform trading decisions.
What MarketMilk Has Detected
MarketMilk detected a Stochastic (14,3,3) bullish signal on the daily timeframe as %K (16.47) crossed above %D (16.44) while both lines remained in oversold territory (below 20).
This crossover arrives after BTC/USD fell from the late-January area near 89,000–90,000 down to 76,136, including a fresh swing low at 72,838 on the current bar.
From recent history, the market has repeatedly reacted around the 87,000–90,000 region (former congestion and multiple closes in late Dec/Jan).
With price now well below that zone, traders often treat it as potential overhead resistance, while the current pullback is probing into a lower area not revisited since the early part of the dataset.
What This Signals
Traditionally, an oversold Stochastic bullish crossover suggests that downside momentum is slowing and can attract mean-reversion buyers, especially after a fast selloff.
If the move is sustained and price begins to print higher highs/higher lows, this signal often marks the early phase of a relief rally attempt rather than an immediate trend change.
However, this same pattern can also represent a brief pause within a broader downswing.
In strong downtrends, Stochastic can generate multiple buy signals that fail as price continues to make lower lows (a classic “oversold can stay oversold” environment), particularly if rallies stall quickly into former support turned resistance near 78,500–80,000 and then 84,000–85,000.
The outcome depends heavily on follow-through in price action, broader trend structure, and whether BTC/USD can reclaim key broken levels. Context and confirmation are essential.
How It Works
The Stochastic Oscillator compares the current close to the recent high-low range (here, over 14 periods), then smooths the result (3,3).
Readings below 20 indicate oversold momentum—meaning price is closing near the bottom of its recent range. A buy signal is commonly observed when %K crosses above %D while oversold, implying downside momentum may be fading.
Important: “Oversold” in Stochastic refers to momentum and positioning within the recent range—not whether BTC/USD is fundamentally cheap. In trending markets, the oscillator can remain oversold for extended periods, and crossovers can whipsaw without a durable reversal.
What to Look For Before Acting
Do not assume this buy signal guarantees a reversal. Consider these factors:
✅ A daily close that holds above the current bar’s midpoint and avoids immediate follow-through selling
✅ Evidence of a higher low forming after the 72,838 swing low (structure shift)
✅ Stochastic continuing to rise and pushing back above 20 (momentum exiting oversold rather than stalling)
✅ Reclaiming nearby resistance around 78,500–80,000 (prior reaction area) and holding it on a retest
✅ Whether rebounds fail or succeed into 84,000–85,000 (late-Jan breakdown zone)
✅ A push back toward 87,000–90,000 would improve the “mean reversion” thesis, but rejection there would also be informative
✅ Expanding daily ranges to the upside (buyers showing urgency rather than a weak drift)
✅ Alignment with the Weekly chart trend/structure (e.g., whether weekly is stabilizing or still making lower lows)
✅ Broader crypto risk tone: correlated strength/weakness across majors and overall risk appetite
✅ Any major macro catalysts that could impact USD risk sentiment (rate expectations, liquidity conditions), which often feed through to BTC/USD volatility
Risk Considerations
⚠️ Downtrend whipsaw risk: Stochastic buy signals can fail repeatedly if sellers remain in control
⚠️ Volatility risk: the current bar shows a wide range (79,117 to 72,838), which can trigger stops on both sides
⚠️ Overhead supply: former support zones near 84,000–85,000 and 87,000–90,000 may cap rebounds
⚠️ False “oversold bounce”: price can bounce briefly while still continuing the larger decline
⚠️ Gap-like behavior in crypto sessions: sharp intraday swings can invalidate neat crossover interpretations
Potential Next Steps
Add BTC/USD to a watchlist and track whether the oversold crossover develops into a broader momentum reset (Stochastic lifting above 20 and staying constructive).
Many traders wait for price confirmation, such as a higher low, a break above a nearby resistance band, or a successful retest, before treating this as more than a short-term rebound signal.
If exploring entries, consider defining risk clearly around the recent swing low region and planning exits around overhead levels (78,500–80,000, then 84,000–85,000, and the 87,000–90,000 band).
Position sizing and stop placement matter more than the signal itself in a high-volatility daily environment.
Bottom line: Bitcoin has transitioned from sideways repair into renewed downside momentum. Until price can reclaim the mid-80k zone and begin forming higher lows, the path of least resistance remains lower or sideways, with risk skewed toward continued volatility and further base-building attempts at lower levels.
If you really love catching falling knives or trying to pick bottoms though….
Trade Idea
Setup:
Buy BTCUSD on a pullback and stabilization attempt near the next major demand zone following the decisive breakdown from the prior consolidation range.
Immediate support is emerging in the 72k–75k zone, where price is currently probing after the range failure. This area represents the next logical demand zone. A brief reaction here would be normal, but it has not yet proven itself as durable support.
The idea is to position for a reflexive bounce and potential base-building attempt after downside momentum becomes stretched.
Entry:
Stand aside and wait for BTCUSD to test the 72,000–75,000 zone, which represents the next key support area after the failure of the 84k–86k range floor.
Look for signs of stabilization such as tight daily ranges, a higher low on intraday timeframes, or a clear bullish reversal candle (e.g., long lower wick, bullish engulfing).
Enter long only once price confirms support by holding this zone and turning back higher. Don’t try to catch the initial flush.
Stop Loss:
Place the stop on a daily close below 70,000. A decisive break below this level would signal that demand has failed and open the door to a deeper corrective move, invalidating the bounce thesis.
Take Profit:
Target the 82,000–85,000 area as the first take-profit zone, corresponding to the former support that is now likely to act as resistance. If price can reclaim and consolidate above that zone, trail stops and look for an extension toward 90,000–92,000, where prior range resistance and supply are concentrated.
This content is strictly for informational purposes only and does not constitute as investment advice. Trading any financial market involves risk. Please read our Risk Disclosure to make sure you understand the risks involved.