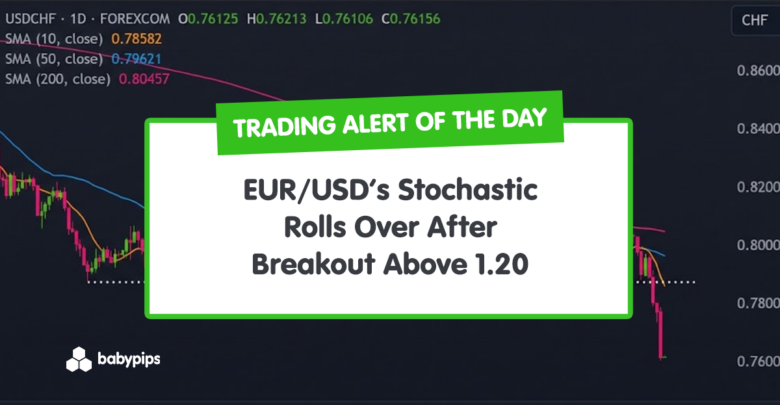
TA Alert of the Day: Bearish Stochastic Crossover Appears on EUR/USD After Rapid Rally
2026-01-29 00:56:00
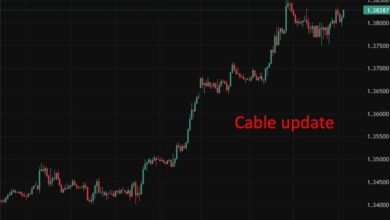
EUR/USD just posted a sharp daily pullback after a fast run-up, and momentum is starting to cool from elevated levels.
The latest Stochastic crossover adds an extra layer of tension as traders gauge whether this dip is a pause…or the start of something more meaningful.
Welcome to “TA Alert of the Day.” Each day after the market close, MarketMilk scans for popular technical indicator alerts. We use these alerts as the basis for a mini-lesson, breaking down what each alert means, why it matters, and how traders might interpret it. The goal is to help beginner traders not only spot these alerts but also understand the logic behind them and how they can inform trading decisions.
What MarketMilk Has Detected
For months, EURUSD oscillated in a broad sideways band with multiple failed attempts to sustain moves above the highlighted resistance zone, indicating that area was a key supply region watched by market participants.
The latest advance drove price straight up from the mid 1.16s through that resistance zone and into the low 1.20s in just a handful of sessions, creating a series of large green candles and a short-term parabolic feel.
MarketMilk detected a bearish Stochastic (14,3,3) crossover on the daily chart, with %K crossing below %D while both remain in overbought momentum territory (current %K: 86.02, %D: 91.37).
This occurred immediately after EUR/USD surged to the 1.2083 area (prior day high) and then sold off to close near 1.1954.
From the recent range, the pullback brings price back toward an area that has acted as a pivot zone around 1.1880–1.1907 (recent breakout region), while the latest upswing also highlights overhead supply near 1.2040–1.2083.
What This Signals
A bearish Stochastic crossover from overbought conditions often marks a loss of upside momentum after an extended push higher.
If the move is sustained, it can attract traders looking for a pullback toward nearby support zones, especially when it appears after a sharp upside expansion like the late-January rally from the 1.16s into the 1.20 handle.
However, this same pattern can also represent a routine reset within a strong uptrend, where prices briefly dip and Stochastic unwinds without delivering a deeper decline.
In trending markets, overbought momentum can persist, and crossovers can whipsaw, particularly if price quickly reclaims the 1.2040–1.2080 area.
The outcome depends heavily on follow-through in price action, the strength of nearby support (notably 1.1880–1.1900), and whether broader trend conditions remain constructive on higher timeframes.
How It Works
The Stochastic (14,3,3) oscillator compares the latest close to the recent high-low range (here, over 14 periods), producing %K (the faster line) and a smoothed %D signal line. A bearish signal triggers when %K crosses below %D, suggesting momentum is shifting from acceleration to deceleration.
Important: Stochastic measures momentum, not valuation, and “overbought” readings (above 80) can remain elevated for long periods during strong advances. Crossovers are generally more reliable when accompanied by clear price-based confirmation (e.g., a break of support or a failure to reclaim prior highs).
What to Look For Before Acting
Do not assume a full trend reversal. Consider these factors:
✅ Whether EUR/USD holds or breaks the nearby support zone around 1.1880–1.1907
✅ If the pullback forms a lower high beneath the 1.2040–1.2083 resistance band
✅ Follow-through selling: additional daily closes below 1.1950 rather than an immediate rebound
✅ Signs of demand returning via a strong bullish response candle from support (failed breakdown behavior)
✅ Whether Stochastic continues to roll over toward the midline (50), versus quickly turning back up (whipsaw risk)
✅ Confluence with structure: prior pivot activity near 1.1770–1.1808 as the next downside reference if 1.1880 fails
✅ Trend alignment on the weekly chart (e.g., whether the larger move remains higher despite the daily momentum fade)
✅ Event risk and rate expectations (ECB/Fed guidance, inflation/PMI releases) that can override oscillator signals in FX
Risk Considerations
⚠️ Whipsaw risk: Stochastic crossovers can flip quickly when price ranges or trends strongly
⚠️ Trend persistence: overbought momentum can stay overbought, leading to premature short entries
⚠️ Support snapback: pullbacks into 1.1880–1.1900 could attract dip-buying and trigger sharp rebounds
⚠️ News-driven gaps: FX can reprice abruptly around macro releases, invalidating technical setups
Potential Next Steps
Consider keeping EUR/USD on a watchlist for confirmation around 1.1880–1.1900 and for any failed retest of the 1.2040–1.2083 zone.
If the bearish crossover is followed by additional weakness and a clean break of support, it may strengthen the case for a deeper pullback scenario; if price quickly reclaims recent highs, it may point to a momentum reset instead.
Whichever scenario develops, prioritize clear invalidation levels and position sizing appropriate for daily-range volatility, and remain mindful of scheduled macro catalysts that can dominate short-term technical signals.
This content is strictly for informational purposes only and does not constitute as investment advice. Trading any financial market involves risk. Please read our Risk Disclosure to make sure you understand the risks involved.