2026-01-22 12:01:00
President Donald Trump used his speech at the World Economic Forum in Davos to deliver a message markets were primed to hear: de-escalation geopolitically, and acceleration economically. On Greenland, he was firm on strategic necessity but explicit in ruling out the use of force, which helped strip out immediate geopolitical tail risk while keeping negotiations in play. For markets, that mattered. And European markets even followed through this morning with a bullish tone. At the same time, he leaned heavily into a pro-growth narrative, rejecting the idea that strong economic data should be punished by higher rates. His repeated criticism of the “good news is bad news” dynamic, and his insistence that growth does not automatically mean inflation, landed well with equity investors who have been waiting for confirmation that policy rhetoric is shifting back toward growth tolerance.
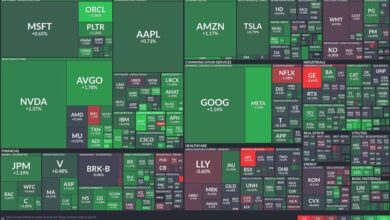
Equally important for NASDAQ traders was Trump’s framing of technology and AI. He positioned AI as a once-in-a-generation opportunity where the US is leading decisively, with innovation prioritized over restriction and regulation clearly secondary to speed and scale. Combined with repeated references to massive capital investment, factory buildouts, and productivity-driven growth, the speech reinforced the case for risk-on positioning in growth and technology stocks. The immediate post-speech rally reflected this mix: lower perceived geopolitical risk, renewed confidence that strong growth will be rewarded rather than punished, and continued political backing for AI, compute, energy, and infrastructure. With that macro and policy backdrop set, the focus now shifts to the charts – and whether NASDAQ price action confirms what the narrative just reinforced.
NASDAQ Technical Analysis: Post-Davos Risk-On Rally Faces Key Technical Tests
Video: NASDAQ technical analysis after Trump’s Davos speech, shown at the top of this page
The NASDAQ saw a renewed risk-on push following Trump’s Davos speech, with futures currently up roughly 0.85% from yesterday’s close. While crypto has not reacted as strongly, US equity futures, and especially NASDAQ futures, have shown a clear technical response that traders should pay close attention to.
This article breaks down the key technical structure, trapped positioning, and the critical price levels that will determine whether this move extends or fades.
Big picture: channel break, reversal, and trapped bears
Technically, NASDAQ futures recently broke down from a well-defined channel, a setup that initially favored shorts. That breakdown was supported by multiple pivot points:
After the gap down following January 16, bears had a textbook short setup. However, that structure failed. Yesterday’s reversal, followed by today’s continuation, signals that short sellers are now trapped, which helps explain the strength of the rebound.
This is a classic failed breakdown scenario, often followed by either:
-
A sharp continuation higher, or
-
A controlled retracement before the next directional move
Medium-term structure: the black trendline and April bottom
From the October low, which coincided with earlier tariff-related news, the market also formed a broader structural base, with an important low marked on April 7, 2025.
That structure was tested again around November 21, forming a longer-term reference line. Price broke below this structure on June 15, and now the market may attempt to retest that broken area from below, potentially as high as 26,400.
Before that happens, however, traders need to focus on nearer-term levels.
Near-term resistance: 25,725 as the first decision zone
One of the most important short-term levels sits at 25,725.
This level does not come from the visible channel alone. It comes from volume profile and VWAP-based analysis, making it a likely area for profit-taking and hesitation.
If price stalls here, it would be consistent with:
The real line in the sand: 25,400–25,470
The most important technical threshold sits lower.
-
The January 20 open and the following day’s close cluster around 25,470
-
The broader decision zone is 25,400
If NASDAQ futures close two consecutive 4-hour candles below 25,400, that would signal that:
-
Bears have regained control
-
Price has slipped back below the channel
-
The prior breakdown structure, or bear flag, is active again
In that scenario, the current rally would be classified as a failed bounce.
VWAP focus: 25,600 as today’s key intraday junction
For today’s session, traders should closely monitor 25,600, which sits near:
This level is critical because it tells us whether:
-
Bulls are willing to defend value and buy pullbacks, or
-
Yesterday’s rally, which began mid-session after the Davos speech, is losing momentum
A clean hold above VWAP keeps the bullish continuation scenario alive. A failure opens the door to deeper retracements.
Downside retracement roadmap if momentum fades
If price pulls back, the following levels come into play:
-
25,600 first test
-
25,425 as a partial profit-taking zone
-
25,315, aligned with the previous VWAP
These are not predictions, but reaction zones where traders should watch order flow and price behavior.
Upside scenario: all-time high area back in play
If the market absorbs supply above 25,725 and momentum remains constructive, a move toward the all-time high area becomes possible. That zone is likely to attract another wave of profit-takers, especially if the move becomes extended.
For now, that scenario is secondary to managing the expected pullback or consolidation.
What traders should focus on now
This analysis is not about forecasting a single outcome. It is about predefined junctions and price reaction.
Key levels to watch:
-
25,725 – near-term resistance and profit-taking zone
-
25,600 – today’s VWAP and intraday decision point
-
25,400–25,470 – structural line in the sand
-
26,400 – potential higher-timeframe retest if strength persists
Come and check out more gems you’ll only see on investingLive Stocks Telegram Channel, including trade ideas.