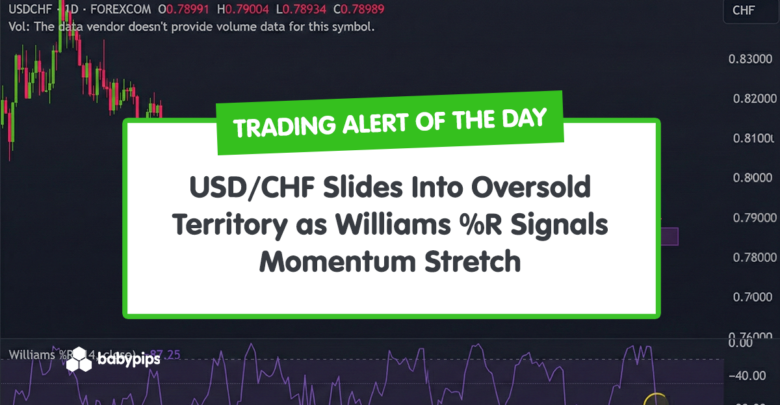
TA Alert of the Day: USD/CHF Slides Into Oversold Territory as Williams %R Signals Momentum Stretch
2026-01-20 23:21:00
Article Highlights
- USD/CHF posted a sharp daily decline, returning price to a familiar support zone near recent lows.
- Downside momentum has accelerated, making the next few sessions critical for signs of stabilization or continued pressure.
- Price action around the 0.788 to 0.792 area will help clarify whether sellers stay in control or momentum begins to ease.
USD/CHF just posted a sharp daily drop, pushing momentum into an area that often gets traders’ attention.
When downside pressure accelerates this quickly, the next few sessions can become more reactive around nearby support zones.
This alert doesn’t imply an immediate reversal on its own, but it does highlight that it may be stretching to the downside.
The key now is whether price action confirms stabilization or whether selling pressure continues to dominate.
Welcome to “TA Alert of the Day.” Each day after the market close, MarketMilk scans for popular technical indicator alerts. We use these alerts as the basis for a mini-lesson, breaking down what each alert means, why it matters, and how traders might interpret it. The goal is to help beginner traders not only spot these alerts but also understand the logic behind them and how they can inform trading decisions.
What MarketMilk Has Detected
Williams %R(14) has moved into oversold territory, dropping to -87.44 after crossing below the -80 threshold.
This coincides with a broad daily selloff, with USD/CHF closing near 0.78985 after printing an intraday low around 0.78781.
From a historical perspective, USD/CHF has repeatedly reacted in the 0.788–0.792 zone in recent months, with multiple closes clustered near 0.788–0.789 in late December.
This development is also notable because it follows the early-January push toward 0.804, suggesting momentum has swung from a local high back toward a familiar support zone.
What This Signals
Traditionally, an oversold Williams %R reading suggests that downside momentum has become stretched and can attract dip-buying or short-covering if the move is sustained by follow-through strength.
In practice, traders often watch for Williams %R to recover back above -80 alongside improving candles, especially when the price is testing an established support area.
However, this same pattern can also represent strong bearish continuation, where prices briefly register “oversold” while the down move continues and the oscillator remains pinned near the lows.
This sometimes coincides with a breakdown phase, where support levels (such as the 0.788–0.792 area) fail, and any rebound attempts are sold into.
The outcome depends heavily on how price behaves around nearby support/resistance and whether momentum unwinds (Williams %R rising) without price making fresh lows.
How It Works
Williams %R is a momentum oscillator that measures where the close sits relative to the highest high and lowest low over a lookback period (here, 14 days).
Readings range from 0 to -100, with values below -80 typically considered oversold momentum (price closing near the bottom of its recent range), and values above -20 considered overbought momentum.
Important: “Oversold” does not mean price is undervalued, and it does not guarantee a reversal. In strong trends, Williams %R can remain oversold for multiple sessions; its usefulness often improves when paired with support levels and a clear shift in price action.
What to Look For Before Acting
Do not assume a bounce is guaranteed. Consider these factors:
✅ Williams %R crossing back above -80, showing momentum is unwinding rather than staying pinned
✅ Evidence of stabilization near the 0.788–0.792 support area (small-bodied candles, reduced downside follow-through)
✅ A daily close back above nearby “reclaim” levels such as 0.792–0.793 (prior clustering zone)
✅ Whether price avoids making a lower low on the next push while Williams %R improves (a potential early momentum improvement setup)
✅ Reaction to overhead resistance zones from recent structure, especially 0.799–0.801 and the early-January swing area near 0.803–0.804
✅ Trend context on the Weekly chart (support holding vs. a broader breakdown)
✅ Nearby catalysts for USD/CHF, such as Fed/SNB communication, inflation releases, or risk sentiment shocks that can override oscillator signals
Risk Considerations
⚠️ Oversold can stay oversold in a sustained selloff, producing early/false “bounce” expectations
⚠️ A support break under the late-December band (~0.788) can quickly invalidate mean-reversion assumptions
⚠️ Sharp one-day moves can lead to whipsaw if the next session retraces and then resumes lower
⚠️ USD/CHF can react abruptly to macro headlines and rate expectations, reducing the reliability of single-indicator signals
Potential Next Steps
Consider keeping USD/CHF on a watchlist for signs that selling pressure is easing, particularly when Williams %R starts to recover and the price holds the 0.788–0.792 area.
A more conservative approach is to wait for confirmation via a daily close reclaiming nearby levels (or a clear reversal-style candle) rather than acting on the oversold reading alone.
If you do trade this setup, focus on practical risk management: define invalidation around the recent swing low area and plan exits around nearby resistance zones such as 0.799–0.801 and 0.803–0.804, where prior rallies have stalled.