Bitcoin (BTC) leading indicators flashed buy signals as bulls fought to keep BTC price above $90,000.
Key takeaways:
Bitcoin Hash Ribbons flashed a “buy” signal amid miner capitulation recovery, an occurrence that has historically preceded strong rallies.
The Fear and Greed Index’s “golden cross” signals improving market sentiment and a potential BTC rally ahead.
Bitcoin must hold $90,000 to avoid a bear market scenario.
Bitcoin Hash Ribbons, sentiment index flash “buy”
Bitcoin miner performance is still telling market participants to buy as sentiment begins to shift across the market.
Hash Ribbons, which measures the 30-day and 60-day moving average of the hash rate, now says that even current prices represent a “long-term buying opportunity,” according to Capriole Investments.
Related: Bitcoin’s ‘internal conditions’ are improving: Glassnode
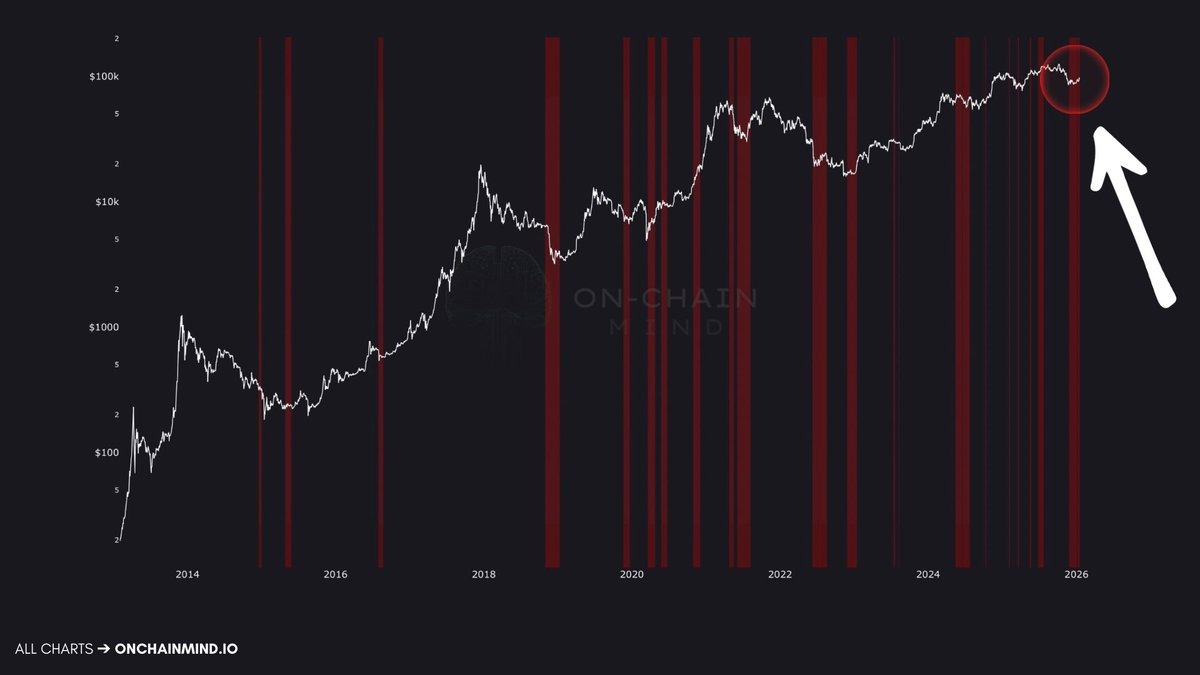
The chart below shows that a “buy signal” emerged when the 30-day MA of the hash rate dropped below its 60-day EMA, an occurrence that has historically marked periods of miner capitulation.
This has “often synced with major price discounts and long-term buying opportunities,” Capriole Investments explains on its website.
Researchers at On-Chain Mind made similar observations, saying that Bitcoin is “seeing one of the largest Hash Ribbons signals on record.”
“When miners capitulate and then recover, it often marks the end of forced selling,” On-Chain Mind said in a Jan. 20 post on X, adding:
“Historically, once this phase resolves, it’s been one of the most compelling long-term buy signals.”
Note that the last time Hash Ribbons sent a buy signal was in July 2025, preceding a 25% BTC price rally from $98,000 to its previous all-time high of $123,200.
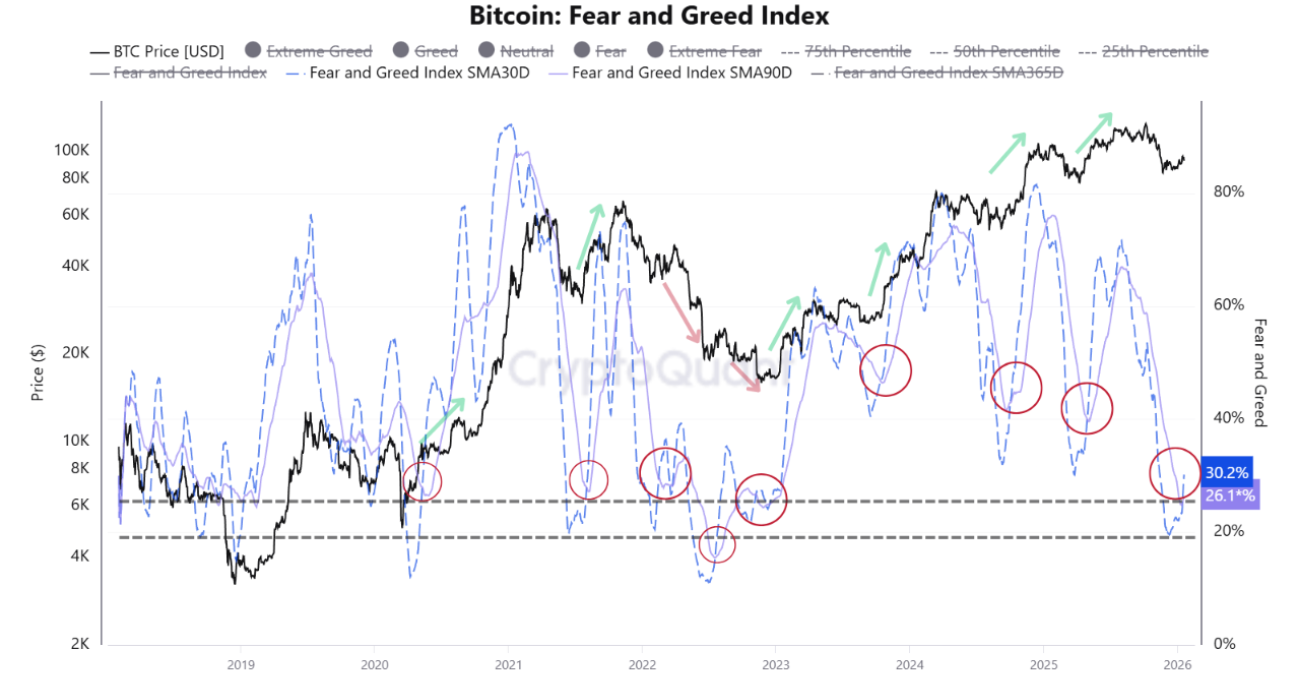
The Fear and Greed index is also suggesting it’s time to buy Bitcoin as a “golden cross signals a potential rally ahead,” according to data from CryptoQuant.
The chart below is a historical pattern analysis revealing a “bullish sentiment shift as 30-day MA crosses above 90-day MA for the first time since May 2025,” said CryptoQuant analyst MorenoDV_ in a recent Quicktake analysis, adding:
“Historically, these crossovers tend to occur after prolonged fear phases, often near local price compression zones rather than major tops. In most highlighted instances on the chart, price responds positively in the weeks that follow.”
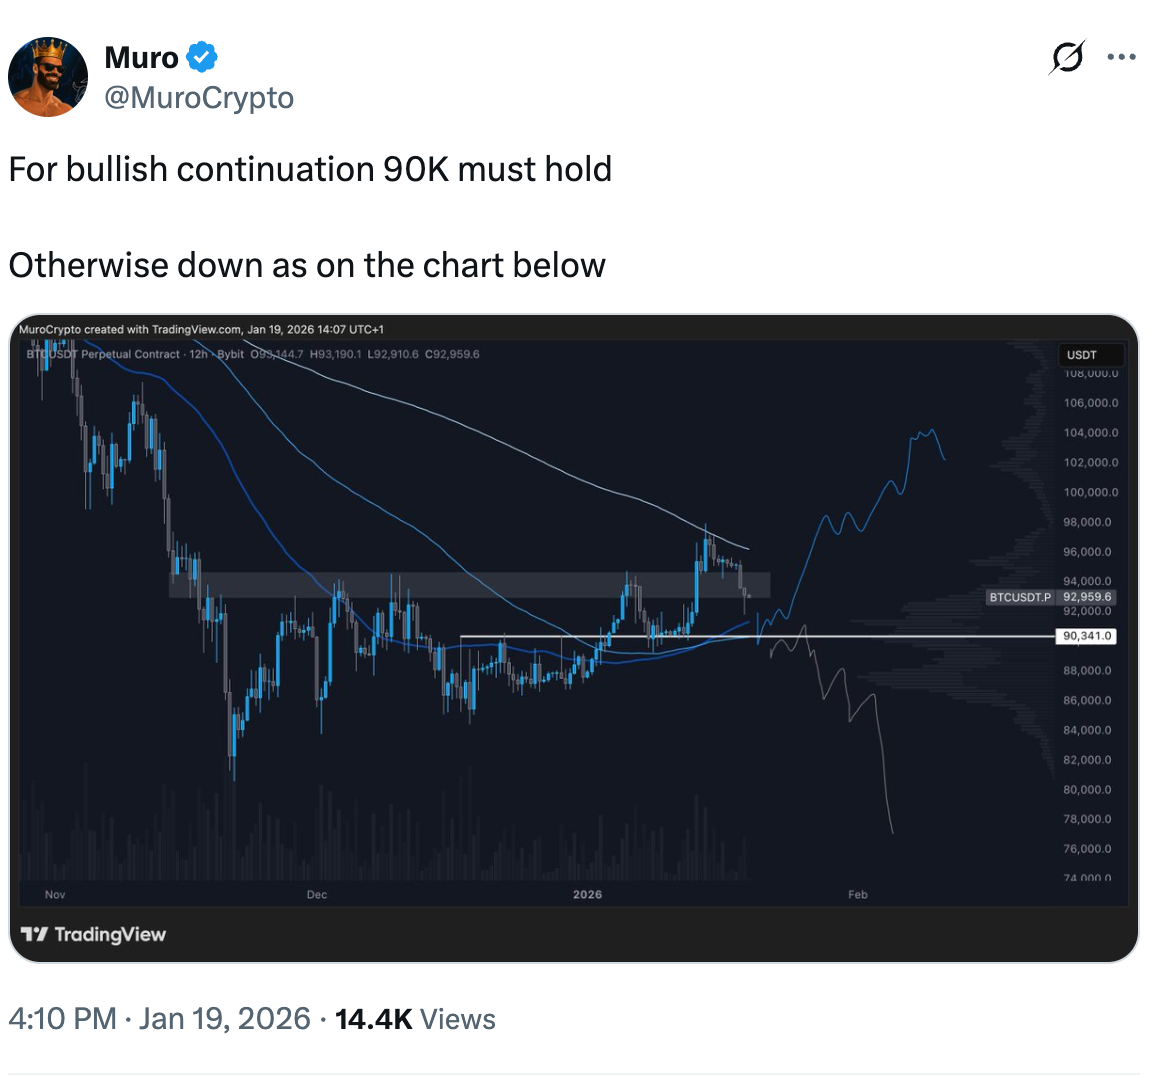
Bitcoin price must hold $90,000
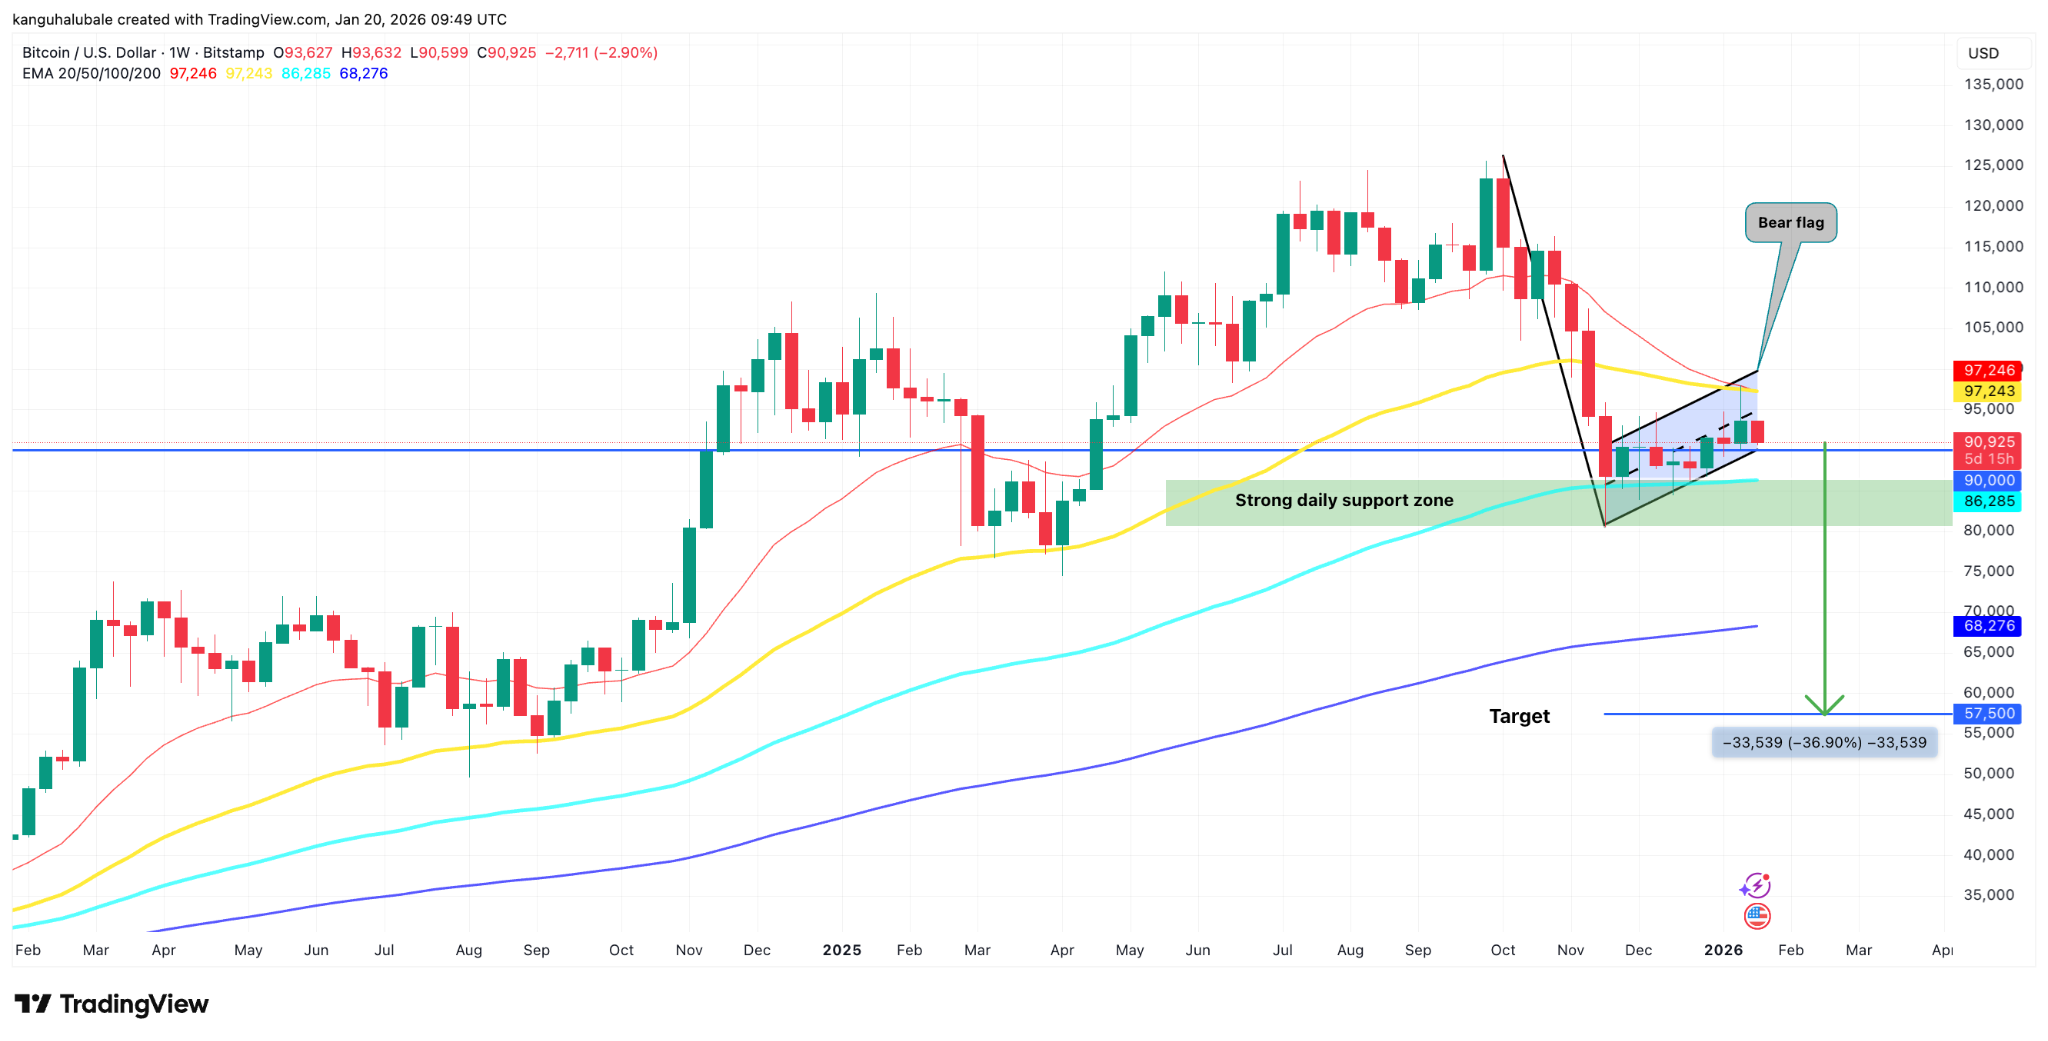
The next important support zone for BTC is at $90,000, a psychological level for the market that the bulls must defend.
The BTC/USD pair is trading within the $90,000–$92,000 range, data from TradingView reveals.
“This area is very important. It has held before, and if the overall bull market is still strong, it needs to hold again,” Crypto Solutions said in an X post on Tuesday, adding:
“As long as $90K holds, buyers are still in control, and another move up is possible.”
This level coincides with the 200-period moving average in the four-hour time frame and the lower boundary of a bear flag, as shown on the weekly chart below.
“If $90K breaks and closes below it on the weekly chart, momentum could turn negative, with a deeper drop toward $80K–$85K,” Crypto Solutions added, referring to a key demand zone on the daily chart.
Lower than that, the April 2025 low at $74,500 and the 200-week MA at $68,000 are key levels to watch on the downside.
The measured target of the bear flag is $57,0500, where Bitcoin could bottom in case of an extended downtrend.
As Cointelegraph reported, Bitcoin is at risk of losing $90,000 as macro pressure and weak technicals point to a possible drop toward $80,000 based on a rising-wedge breakdown.
This article does not contain investment advice or recommendations. Every investment and trading move involves risk, and readers should conduct their own research when making a decision. While we strive to provide accurate and timely information, Cointelegraph does not guarantee the accuracy, completeness, or reliability of any information in this article. This article may contain forward-looking statements that are subject to risks and uncertainties. Cointelegraph will not be liable for any loss or damage arising from your reliance on this information.