2026-01-16 15:00:00
- Prior was 39
- Current single-family home sales 41 vs 42 prior
- Prospective buyers 23 vs 26 prior
- Home sales expectations over the next six months 49 vs 52 prior
In the past month, US 30-year yields have ticked 5-7 basis points higher but there have been signs of buyers wading in via the latest existing home sales report.
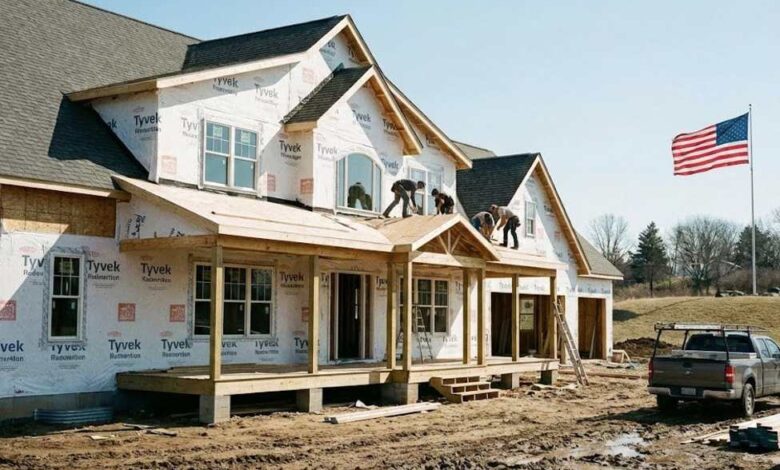
NAHB housing index
The latest survey also revealed that 40% of builders reported
cutting prices in December, marking the second consecutive month the
share has been at 40% or higher since May 2020. It was 41% in November.
Meanwhile, the average price reduction was 5% in December, down from the
6% rate in November. The use of sales incentives was 67% in December,
the highest percentage in the post-Covid period.
The NAHB/Wells Fargo Housing Market Index (HMI) is a monthly economic indicator that gauges builder confidence in the U.S. single-family housing market. Based on a survey of National Association of Home Builders members, it operates on a scale of 0 to 100. A reading above 50 indicates that more builders view conditions as “good” rather than “poor.”
The index is a weighted average of three specific components:
- Current Sales Conditions (59%): Builders rate current sales volume.
- Future Sales Expectations (14%): Outlook for sales over the next six months.
- Prospective Buyer Traffic (27%): The volume of potential buyers visiting model homes.
Currently, the index is low because builders are caught in a “dual squeeze.” On the demand side, high mortgage rates and prices have hurt affordability, forcing builders to offer costly incentives. On the supply side, they are dealing with rising construction costs, labor shortages, and regulatory hurdles, all of which keep confidence below the neutral 50 mark and near the pandemic lows.