2026-01-15 22:39:00
Article Highlights
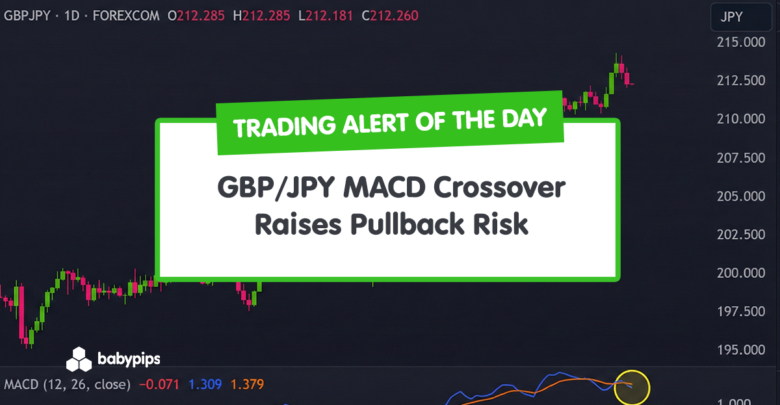
- Daily MACD crossover turns bearish, signaling a loss of upside momentum after GBP/JPY’s rally toward 214.00.
- Price pulls back from recent highs but remains mid-range near 212.25, not yet testing key support below.
- Follow-through is key, with traders watching whether downside momentum develops or stalls within the recent range.
GBP/JPY has started to lose some upside momentum after a strong run into the 214.00 area, with price easing back modestly from recent highs.
While the broader trend remains intact for now, momentum indicators are beginning to shift, hinting that the pace of the move may be changing.
The latest daily close brings fresh attention to how the pair behaves in the coming sessions, particularly as traders assess whether this pullback develops into something more meaningful or simply reflects a temporary pause after an extended run.
With technical signals beginning to flash and price still well above deeper support, the next moves may offer clearer clues about market intent, making this a setup worth keeping on the radar.
Welcome to “TA Alert of the Day.” Each day after the market close, MarketMilk scans for popular technical indicator alerts. We use these alerts as the basis for a mini-lesson, breaking down what each alert means, why it matters, and how traders might interpret it. The goal is to help beginner traders not only spot these alerts but also understand the logic behind them and how they can inform trading decisions.
What MarketMilk Has Detected
At market close today, MarketMilk detected a bearish MACD(12,26,9) crossover on the 1d timeframe, where the MACD line moved below the signal line (previous: 1.341405 vs 1.303606; current: 1.275196 vs 1.297924).
This shift suggests that upside momentum has softened relative to its recent pace.
Price also slipped from the recent push toward 214.29 (the latest swing high) back toward the 211.00–211.60 region, an area that has acted as a recurring pivot since mid-December.
The move follows a broader climb from the ~200–202 base in early November to the 211–214 range seen since late December.
What This Signals
Traditionally, a bearish MACD crossover suggests that bullish momentum is fading and can attract traders looking for a pullback or a transition into consolidation.
If the move is sustained, it often marks the start of a corrective phase, especially after an extended advance like the one from the November lows into the 214 area.
However, this same pattern can also represent a temporary momentum reset within a broader uptrend, where prices briefly dip and then re-accelerate higher.
In that case, the crossover can become a “whipsaw” signal, particularly if GBP/JPY holds above nearby support (such as the 211.00–211.60 zone) and quickly reclaims the 213.00–213.60 area.
The outcome depends heavily on follow-through price action, the broader trend structure, and where price is reacting relative to key support/resistance.
Context and confirmation are essential because MACD is a momentum/trend-following tool and can lag during turning points.
How It Works
The MACD (Moving Average Convergence Divergence) compares two exponential moving averages (typically 12 and 26 periods) to measure momentum and trend direction.
The signal line is an EMA of the MACD line (commonly 9 periods).
A bearish crossover occurs when the MACD line crosses below the signal line, indicating momentum is shifting lower relative to its recent average.
Important: MACD crossovers can be less reliable in sideways markets and after sharp one- or two-day spikes. They tend to perform best when paired with structure (support/resistance), and when the crossover is followed by continued downside movement rather than an immediate reclaim.
What to Look For Before Acting
Do not assume this crossover guarantees a downtrend. Consider these factors:
✅ Whether GBP/JPY holds or breaks the 211.00–211.60 support/pivot zone (recent consolidation area)
✅ A daily close below ~211.00 to confirm acceptance beneath support rather than an intraday dip
✅ How price reacts around 210.50–210.70 (late-Dec/early-Jan lows and repeated basing area)
✅ Whether rallies stall below 213.00–213.60 (recent swing area; potential “lower high” location)
✅ A retest of the breakdown level (if support breaks) that holds as new resistance
✅ The MACD histogram is staying negative and expanding (often indicates momentum is continuing rather than flipping back)
✅ Trend confirmation on a Weekly chart (higher timeframe alignment for a Daily signal)
✅ Upcoming BoE and BoJ catalysts (rate expectations, guidance, inflation/wage releases) that can override technical momentum
✅ Broader risk sentiment and yield moves (JPY pairs often react to global rates and risk-on/risk-off swings)
Risk Considerations
⚠️ Whipsaw risk: If GBP/JPY remains range-bound between ~211 and ~214, MACD crossovers can flip repeatedly.
⚠️ Lagging nature of MACD: The crossover may occur after a meaningful portion of the pullback has already happened.
⚠️ Support snapback: The 211.00–211.60 zone has acted as a pivot; bounces from this area can invalidate bearish follow-through quickly.
⚠️ Event-driven volatility: Central-bank commentary or surprise data can negate technical signals in a single session.
Potential Next Steps
Consider keeping GBP/JPY on a watchlist and monitoring whether price breaks and holds below the 211.00–211.60 area or instead stabilizes and reclaims 213.00+.
If you trade this signal, wait for confirmation via structure (a support break and/or failed retest) rather than relying on the crossover alone.
Whichever scenario develops, focus on clear invalidation levels, position sizing, and the possibility of fast reversals, especially around recent swing levels near 214.00–214.30 and support near 210.50–211.00.