Markets delivered mixed signals on Wednesday as precious metals surged to historic highs amid geopolitical tensions and Federal Reserve independence concerns, while equities declined despite stronger-than-expected economic data that included robust retail sales and moderate producer price inflation.
Check out the forex news and economic updates you may have missed in the latest trading session!
Forex News Headlines & Data:
- U.S. API Crude Oil Stock Change for January 9, 2026: 5.27M (-2.8M previous)
- New Zealand Building Permits for November 2025: 2.8% m/m (1.0% m/m forecast; -0.9% m/m previous)
- Japan Reuters Tankan Index for January 2026: 7.0 (11.0 forecast; 10.0 previous)
- Australia Building Permits Final for November 2025: 20.2% y/y (20.2% y/y forecast; -1.8% y/y previous)
- Australia Private House Approvals Final for November 2025: 1.3% m/m (1.3% m/m forecast; -2.1% m/m previous); 15.2% y/y (15.2% y/y forecast; -6.4% y/y previous)
- China Balance of Trade for December 2025: 114.1B (105.0B forecast; 111.68B previous)
- China Exports for December 2025: 6.6% y/y (5.9% y/y previous)
- China Imports for December 2025: 5.7% y/y (1.9% y/y previous)
- Japan Machine Tool Orders for December 2025: 10.6% y/y (11.0% y/y forecast; 14.2% y/y previous)
- China Vehicle Sales for December 2025: -6.2% y/y (3.1% y/y forecast; 3.4% y/y previous)
- U.S. MBA Mortgage Applications for January 9, 2026: 28.5% (-10.0% previous)
- U.S. MBA 30-Year Mortgage Rate for January 9, 2026: 6.18% (6.25% previous)
- U.S. PPI Growth Rate for November 2025: 0.2% m/m (0.2% m/m forecast; 0.1% m/m previous); 3.0% y/y (2.6% y/y forecast; 2.8% y/y previous)
- U.S. Core PPI for November 2025: 0.0% m/m (0.2% m/m forecast; 0.3% m/m previous); 3.0% y/y (2.5% y/y forecast; 2.9% y/y previous)
- U.S. Retail Sales for November 2025: 0.6% m/m (0.3% m/m forecast; 0.0% m/m previous); 3.3% y/y (3.0% y/y forecast; 3.5% y/y previous)
- U.S. Existing Home Sales for December 2025: 5.1% m/m (-1.6% m/m forecast; 0.5% m/m previous)
- EIA Crude Oil Stocks Change for January 9, 2026: 3.39M (-3.83M previous)
Broad Market Price Action:
Dollar Index, Gold, S&P 500, Oil, U.S. 10-yr Yield, Bitcoin Overlay Chart by TradingView
Wednesday’s session showcased the divergence between safe-haven assets and risk assets, with precious metals soaring to record highs while equities and oil struggled despite economic data showing consumer resilience and moderate inflation pressures at the wholesale level.
Gold posted solid gains of 0.66%, closing near $4,627. The precious metal traded relatively rangebound through the Asian session before strengthening through London hours and extending gains during the US session. The rally likely reflected mounting safe-haven demand driven by multiple catalysts: escalating geopolitical tensions between the US and Iran, ongoing concerns about Federal Reserve independence following the Justice Department’s investigation into Fed Chair Powell, and expectations for continued monetary easing. Silver dramatically outperformed gold in percentage terms, climbing above $90 per ounce for the first time and extending a rally that has seen the white metal gain nearly 200% year-over-year, though it’s not included on this overlay chart.
Bitcoin continued its strong performance, rallying 2.14% to trade around $97,421. The cryptocurrency traded sideways through the Asian session before strengthening steadily during London and US hours. The rally appeared to reflect improving risk sentiment following the softer-than-expected US inflation data and possibly benefited from the narrative that decentralized assets offer protection amid concerns about central bank independence and geopolitical instability.
Bitcoin continued its strong performance, rallying 2.14% to trade around $97,421. The cryptocurrency traded sideways through the Asian session before strengthening steadily during London and US hours. The rally appeared to reflect improving risk sentiment following the softer-than-expected US inflation data and possibly benefited from the narrative that decentralized assets offer protection amid concerns about central bank independence and geopolitical instability.
The S&P 500 declined 0.56% to close near 6,921, extending losses for a third consecutive session despite the encouraging economic data. The index weakened steadily through the US session, possibly reflecting profit-taking in technology shares and concerns that strong retail sales could keep the Federal Reserve cautious about rate cuts despite the moderate PPI readings. The disconnect between strong consumer spending and equity weakness suggested traders may be concerned about valuation levels or repositioning ahead of upcoming earnings reports from major financial institutions.
WTI crude oil posted modest gains of 0.13% to settle around $60.75 per barrel. The energy market experienced distinct directional shifts throughout the session: oil rallied strongly during the London session, possibly on lingering geopolitical risk premium from ongoing US-Iran tensions, before reversing sharply lower during the US session. The afternoon decline likely correlated with President Trump’s Tuesday afternoon comments in which he softened his earlier rhetoric on Iran, saying he had been assured that Iran would stop killing protesters and there would be no executions. The de-escalation in tensions reduced the geopolitical risk premium that had been supporting crude prices, outweighing the impact of the crude inventory report showing a build of 3.39 million barrels.
Treasury yields declined 0.96% to trade around 4.14% on the 10-year note. Yields fell sharply during the US session following the economic data releases at 8:30 am ET. While both PPI and retail sales data might typically support higher yields—the former showing inflation slightly above forecast on a year-over-year basis and the latter demonstrating consumer strength—bond buyers appeared to focus on the flat core PPI monthly reading and expectations that delayed data from the government shutdown would keep the Fed cautious about policy changes. The yield decline also likely reflected increased demand for safe-haven Treasuries amid the geopolitical tensions.
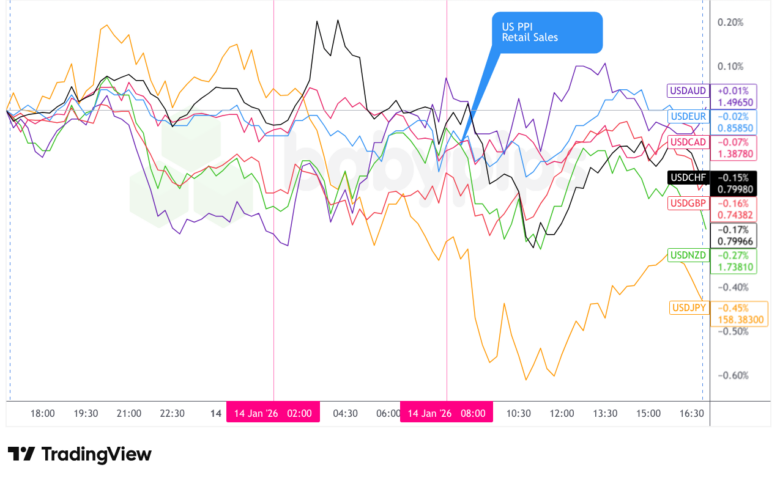
FX Market Behavior: U.S. Dollar vs. Majors
The U.S. dollar experienced choppy and mixed trading throughout Wednesday, ultimately closing with losses against all major currencies as markets navigated economic data releases and evolving geopolitical tensions.
During the Asian session, the dollar traded with an arguably net bearish lean against most major currencies. The moves were relatively muted with no major economic catalysts driving clear directional momentum, though traders may have been positioning cautiously ahead of the US economic data releases scheduled for 8:30 am ET. The yen showed relative weakness during this period, possibly reflecting overnight positioning adjustments following softer-than-expected Japanese economic data, including the Reuters Tankan Index coming in at 7.0 versus 11.0 forecast.
The London session saw the dollar trade choppy and mostly sideways, with mixed performance across currency pairs. Without significant European economic data to drive direction, markets appeared to consolidate positions ahead of the critical US data releases. Currency pairs displayed relatively tight ranges, suggesting traders were reluctant to take aggressive positions before the PPI and retail sales figures from the U.S.
The US session brought the day’s most significant market-moving events with the 8:30 am ET release of both U.S. PPI and retail sales data for November. The dollar initially traded sideways immediately following the releases, possibly reflecting the mixed signals from the data: PPI came in at 0.2% monthly as expected but showed a higher-than-forecast 3.0% year-over-year reading, while core PPI was flat versus the 0.2% estimate. Retail sales exceeded expectations at 0.6% versus 0.3% forecast, demonstrating consumer resilience.
Following the initial digestion of the data, the dollar experienced a net bearish drift through the remainder of the US session. This weakness likely reflected several factors: lower Treasury yields as bond markets focused on the flat core PPI reading, ongoing concerns about Federal Reserve independence weighing on dollar sentiment, and the broader flight to alternative safe havens like gold and silver rather than the traditional dollar bid.
Fed speeches during the session provided measured commentary but offered little new policy insight. Governor Stephen Miran’s remarks on deregulation and monetary policy and President Williams’ emphasis on economic resilience and data-dependent policy reinforced the message that the Fed remains in wait-and-see mode, particularly given data quality concerns stemming from the recent government shutdown.
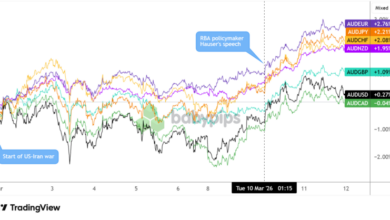
At Wednesday’s close, the dollar posted net losses against all major currencies, with particular weakness versus the yen (-0.45%) and broadly distributed losses against the euro and other G10 currencies. The greenback’s underperformance appeared to reflect the complex interplay of geopolitical risk creating demand for alternative safe havens, concerns about central bank independence weighing on dollar sentiment, and moderating expectations for an aggressive Fed policy stance given the mixed inflation signals and data quality uncertainties.
Upcoming Potential Catalysts on the Economic Calendar
- Japan PPI for December 2025 at 11:50 pm GMT
- Australia Consumer Inflation Expectations for January 2026 at 12:00 am GMT
- U.K. RICS House Price Balance for December 2025 at 12:01 am GMT
- U.K. Industrial & Manufacturing Production for November 2025 at 7:00 am GMT
- U.K. Industrial Production for November 2025 at 7:00 am GMT
- U.K. GDP for November 2025 at 7:00 am GMT
- U.K. Balance of Trade for November 2025 at 7:00 am GMT
- France Inflation Rate Final for December 2025 at 7:45 am GMT
- China Monetary Developments for December 2025
- Euro area Industrial Production for November 2025 at 10:00 am GMT
- Euro area Trade Balance for November 2025 at 10:00 am GMT
- U.K. NIESR Monthly GDP Tracker for December 2025 at 12:00 pm GMT
- Canada Manufacturing & Wholesale Sales Final for November 2025 at 1:30 pm GMT
- Philadelphia Fed Manufacturing Index for January 2026 at 1:30 pm GMT
- NY Empire State Manufacturing Index for January 2026 at 1:30 pm GMT
- U.S. Initial Jobless Claims for January 10, 2026 at 1:30 pm GMT
- U.S. Import & Export Prices for November 2025 at 1:30 pm GMT
- U.S. Overall Net Capital Flows for November 2025 at 9:00 pm GMT
Thursday’s calendar features a critical US jobless claims report that could provide insight into labor market conditions following recent data quality concerns from the government shutdown. UK economic data including GDP and industrial production may influence Bank of England rate expectations, while eurozone industrial production could shed light on the region’s manufacturing weakness.
During the US session, the Philadelphia Fed and NY Empire State manufacturing surveys for January will offer the first real-time business sentiment readings for 2026, potentially revealing how tariff discussions and policy uncertainty are affecting manufacturing activity. Markets will also be watching for any additional commentary from Federal Reserve officials on how they’re interpreting the recent mixed inflation signals and whether data quality concerns stemming from the government shutdown are influencing their policy outlook.
The geopolitical situation remains a wildcard, with ongoing tensions between the US and Iran and concerns about Federal Reserve independence continuing to support safe-haven demand in precious metals and potentially influencing currency market dynamics.
Stay frosty out there, forex friends, and don’t forget to check out our Forex Correlation Calculator when planning to take on risk!