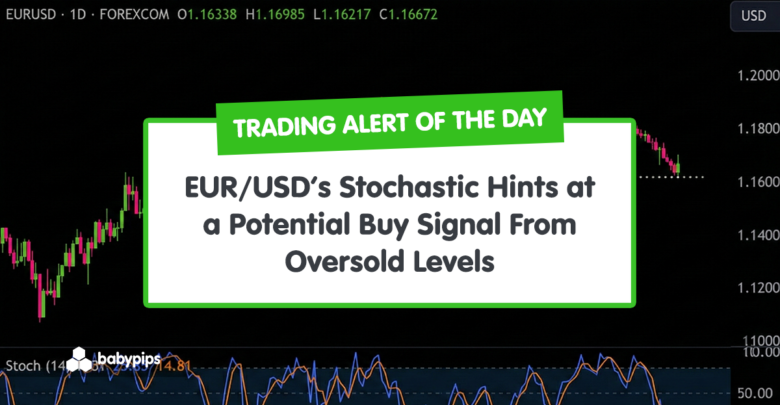
TA Alert of the Day: EUR/USD’s Stochastic Hints at a Potential Buy Signal From Oversold Levels
2026-01-12 22:41:00
EUR/USD is attempting to stabilize after a sharp pullback from late-December highs.
Momentum just flashed a classic “early turn” setup. The Stochastic is crossing higher from oversold territory, a condition that often precedes a rebound.
This is the type of shift that often gets attention because it can develop before the price has made an obvious trend change.
Welcome to “TA Alert of the Day.” Each day after the market close, MarketMilk scans for popular technical indicator alerts. We use these alerts as the basis for a mini-lesson, breaking down what each alert means, why it matters, and how traders might interpret it. The goal is to help beginner traders not only spot these alerts but also understand the logic behind them and how they can inform trading decisions.
What MarketMilk Has Detected
Stochastic (14,3,3) has created a potential “buy” signal on the daily timeframe: %K (14.83) crossed above %D (12.69) while both remain in oversold territory (below 20).
This occurs after EUR/USD slid from the late-December area near 1.179–1.180 down into the early-January trough zone around 1.162–1.164.
From the historical swings, the 1.162–1.165 region has acted as a recurring decision area (multiple October/November pivots), while the recent rebound is now pushing back toward near-term resistance around 1.170.
What This Signals
A Stochastic signal from oversold levels often marks improving short-term momentum after a decline, and it can attract dip-buyers looking for a bounce toward prior resistance zones.
If follow-through is sustained, traders sometimes read this as the market transitioning from “sell the rallies” behavior to a more balanced or recovery phase.
However, this same pattern can also represent nothing more than a brief momentum reset inside an ongoing pullback.
In trending markets, Stochastic can stay oversold (or quickly return to oversold) while price makes only a shallow bounce, creating “false starts” where prices briefly lift, stall near resistance, and roll back over.
The outcome depends heavily on trend context, where price is relative to nearby support/resistance, and whether momentum improvement is confirmed by continued higher closes.
How It Works
The Stochastic oscillator compares the current close to the recent 14-period high-low range. The %K line tracks the oscillator’s raw momentum, while %D is a smoothed signal line.
A common “buy” trigger occurs when %K crosses above %D, especially when both are below 20, an area associated with oversold momentum (not “undervalued” price).
Important: Oversold readings can persist during strong downswings, and crossovers can whipsaw when the price is range-bound. Stochastic signals tend to work best when they align with a clear support area and are confirmed by price structure (higher highs/higher lows) rather than the oscillator alone.
What to Look For Before Acting
Do not assume this guarantees a durable reversal higher.
Consider these factors:
✅ A daily close holding above the recent support band around 1.162–1.164
✅ Follow-through strength: additional higher daily closes after the crossover
✅ Price reclaiming and holding above the 1.170 area (near-term resistance from recent swings)
✅ Whether the rebound can challenge the late-December supply zone near 1.177–1.180 without immediate rejection
✅ Stochastic continuing upward (e.g., %K moving away from 20 rather than rolling back down)
✅ Signs of basing behavior (higher low formation on price, reduced downside ranges)
✅ 4-Hour structure aligning with the daily signal (e.g., a sequence of higher highs/higher lows on the bounce)
✅ Event risk check: upcoming ECB/Fed communication, inflation, and labor data that can override oscillator signals in FX
Risk Considerations
⚠️ Whipsaw risk: stochastic crossovers below 20 can fail quickly if the broader downswing remains intact
⚠️ Resistance overhead: rebounds may stall near 1.170 and again near 1.177–1.180
⚠️ Trend persistence: oversold momentum can stay oversold during strong directional moves, limiting the signal’s timing value
⚠️ Macro volatility: EUR/USD can extend sharply around major data/central bank headlines, impacting stops and targets
Potential Next Steps
You can add EUR/USD to your watchlist and monitor whether the price can hold above 1.162–1.164 while building follow-through above 1.170.
More conservative traders may prefer to wait for a clearer break-and-hold above resistance or a higher-low confirmation on price before treating the signal as actionable.
If you’re thinking about trading this setup, consider pre-defining invalidation (where the idea no longer fits) and sizing risk appropriately for daily-range moves and event-driven volatility.