2026-01-08 04:42:00
Date: January 8, 2026 (23:23, Wednesday, 7 January 2026, Eastern Time (ET))
By investingLive.com Head of Strategy and analyst, Itai Levitan, using orderFlow Intel
Market Focus: Gold Futures (GC), February 2026 Contract
Gold Technical Analysis Summary (Key Takeaways)
-
Gold technical analysis confirms a trend day down after failure above key value levels.
-
A clear look-above-and-fail near 4475 triggered renewed selling pressure.
-
Order flow shows weak downside support, suggesting consolidation is corrective, not bullish.
-
Gold price prediction bias remains bearish, with 4430 acting as the next downside magnet.
Gold Technical Analysis Today: Anatomy of the Bearish Trend
Gold Technical Analysis: From Consolidation to Trend Breakdown
Today’s gold technical analysis shows a decisive shift in market structure. What began as an attempt to stabilize has evolved into a confirmed bearish trend. Early session strength was aggressively sold, and once price lost the 4450 support zone, downside momentum accelerated.
From a structural perspective, gold is no longer rotating within balance. Value is migrating lower, VWAP is acting as resistance, and order flow confirms sellers remain in control. Based on these factors, our OrderFlow Score stands at -8, signaling strong bearish conditions rather than a temporary dip.
Gold Price Action Breakdown: The Look Above and Fail Pattern
Understanding the morning sequence is critical for gold price prediction today.
-
Opening context: Gold opened near 4467 and pushed higher toward 4475-4476, aligning with yesterday’s Value Area High.
-
Rejection: Sellers stepped in aggressively at 4475.2, preventing acceptance above value.
-
Result: Once price failed above value, selling intensified and gold broke below 4450, confirming a bearish continuation pattern.
This type of look-above-and-fail is a classic technical signal that often precedes range expansion to the downside.
Order Flow Insight for Gold: Thin Support at the Lows
Gold is currently pausing between 4440 and 4448, which may appear constructive on higher timeframes. However, deeper order flow analysis paints a different picture.
Weak Support Structure
This type of price behavior typically represents corrective consolidation, not a bottoming process. Sellers are pausing, not exiting.
Value Area Migration Confirms Bearish Bias
When value shifts lower, it confirms that the market is accepting lower prices. In gold technical analysis, value migration is one of the strongest trend-confirmation signals.
Gold Price Prediction: Bearish Bias Remains Intact
OrderFlow Score: -8 (Strong Bearish)
Market Condition: Trend continuation
-
Major supports including 4450 and VWAP have failed.
-
Upside attempts lack volume expansion and delta confirmation.
-
The pause at current lows appears tactical, not structural.
Unless proven otherwise, the technical evidence favors additional downside.
Key Gold Technical Levels to Watch for Today
Resistance Zone: 4448 to 4454
Former support at 4450 has flipped into resistance.
Downside Target: 4430
This level represents unfinished auction activity and remains a liquidity magnet.
Bearish Invalidation Level: Above 4460
-
To neutralize the bearish gold technical outlook, bulls must reclaim 4460 with strong volume and sustained acceptance above VWAP.
-
Until that occurs, rallies are technically corrective.
Educational Insight: Identifying Real Support in Gold Technical Analysis
A common challenge in gold technical analysis is distinguishing real support from perceived support.
-
On higher timeframes, volume clusters can look like accumulation.
-
On lower timeframes, those same areas may reveal thin, easily breakable bids.
This is why professional gold price prediction relies on multi-timeframe confirmation. Today’s micro order flow confirms that current support lacks depth, increasing the odds of another downside leg.
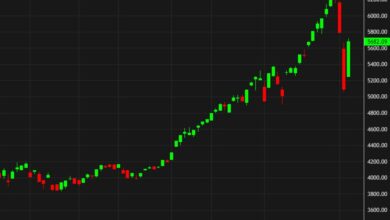
Gold Chart of the Day (so far… stay tuned for more at our Telegram Channel)
Gold futures hourly chart, price below 20EMA and VWAP
Disclaimer: This gold technical analysis and gold price prediction are for educational purposes only and do not constitute financial advice. Futures trading involves substantial risk and may not be suitable for all traders.