China’s factory sector just flashed its first green light in eight months—and forex markets are paying attention.
After months hovering in contraction territory, China’s official manufacturing Purchasing Managers’ Index (PMI) rose to 50.1 in December 2025, up from 49.2 in November. That might sound like a tiny move, but it represents the first time since April that the world’s second-largest economy has signaled expansion in its factory sector. For new traders wondering why a 0.9-point uptick matters, the answer lies in understanding what PMI actually measures—and why China’s economic pulse ripples through global forex markets, particularly commodity-linked currencies like the Australian and New Zealand dollars.
What Actually Is PMI?
Think of the Purchasing Managers’ Index as the economy’s monthly report card, but instead of asking consumers how they feel, it surveys the people actually running factories. Each month, China’s National Bureau of Statistics asks purchasing managers at hundreds of manufacturing companies about five key areas: new orders, production levels, employment, supplier delivery times, and inventory purchases.
PMI is what’s called a “diffusion index.” For each question, respondents answer whether conditions improved, worsened, or stayed the same compared to last month. The calculation takes the percentage of “improved” responses, adds half the “unchanged” responses, and weights them (new orders 30%, production 25%, employment 20%, delivery times 15%, inventories 10%).
The magic number? 50.0—the threshold separating expansion from contraction. Above 50 means more managers reported improving conditions than worsening ones. Below 50 signals deterioration. December’s 50.1 reading means China’s manufacturing sector crossed from contraction into expansion territory, albeit barely.
Why does this matter more than quarterly GDP reports? Because PMI is a leading indicator—it reflects what’s happening right now in factories and often predicts where the broader economy is headed in the next few months. PMI gives traders a real-time glimpse into economic momentum.
What’s Behind China’s December Rebound?
The move back above 50 didn’t happen in a vacuum. Production jumped to 51.7 (up 1.7 points), new orders climbed to 50.8 (up 1.6 points), and high-tech manufacturing surged to 52.5 (up 2.4 points)—all suggesting genuine momentum beneath the headline number.
The timing matters: In early December, China held its annual Central Economic Work Conference, where leadership pledged “more proactive fiscal policy” for 2026, including interest rate cuts and increased government spending. Factory managers appear to have responded to these policy signals with renewed confidence.
Why Should Forex Traders Care About Chinese Factories?
China is the world’s largest importer of industrial commodities—when Chinese factories expand, they need more iron ore, copper, and coal. This creates ripple effects in currencies of commodity-exporting nations.
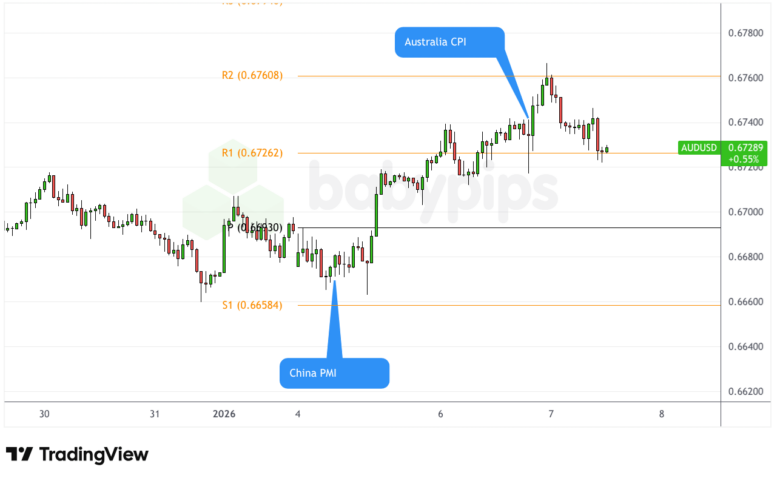
The Australian dollar provides the perfect example. China is Australia’s largest trading partner, accounting for roughly one-third of exports, with iron ore alone representing a massive chunk. This arguably was a strong bullish contributor to recent Aussie strength, as AUD/USD surged to around $0.6750 this week—its highest level since October 2024—climbing roughly 8% through 2025.
But here’s the twist: the AUD’s rally reflects two narratives working in tandem. Yes, China’s manufacturing recovery supports commodity demand. But Australia is also experiencing sticky inflation (3.4% in November, above the RBA’s 2-3% target), and the Reserve Bank of Australia’s December minutes revealed policymakers are prepared to raise rates if inflation doesn’t ease.
Markets now price in roughly 39% probability of an RBA rate hike as early as February 2026—a sharp divergence from most major central banks, which are cutting rates. This “policy divergence” (one central bank tightening while others ease) is a powerful currency driver. The combination of China’s manufacturing revival plus Australia’s potential rate hikes has created a potent cocktail lifting the Aussie.
The New Zealand dollar also tends to move on Chinese data, though its exports to China lean more toward dairy and tourism rather than industrial metals, making it slightly less sensitive to manufacturing PMI specifically.
The Cautiously Optimistic Case
Should traders view this as a definitive turning point? Perhaps, but with important caveats.
First, 50.1 is barely above the expansion threshold—this isn’t a robust boom. Small and medium enterprises fell to 48.6, suggesting smaller businesses still struggle. Export orders remained at 49.0 (contraction), reflecting weak foreign demand. Employment continues declining, and manufacturers are cutting prices to support sales—hardly signs of robust expansion.
That said, direction matters. After eight months below 50, crossing into expansion—even marginally—represents a meaningful shift. Combined with Beijing’s commitment to more stimulus in 2026, there are grounds for cautious optimism that manufacturing has bottomed.
The Bottom Line
What new traders should take away:
- PMI is a leading indicator: The 50 threshold is critical. Above it signals expansion, below signals contraction. China’s move to 50.1 suggests factories are growing again, albeit slowly.
- China’s economy drives global commodity demand: When Chinese manufacturing expands, commodity-exporting countries like Australia benefit through increased demand for raw materials. This relationship makes China’s PMI a key watch-point for AUD and NZD traders.
- Policy matters as much as data: The timing of this rebound—right after China’s leadership promised more stimulus—shows how policy expectations can influence business confidence and economic activity.
- Multiple factors drive currencies: The Australian dollar’s recent surge demonstrates how currency movements often reflect multiple narratives simultaneously—in this case, both China’s manufacturing recovery (supporting commodity demand) and Australia’s sticky inflation (raising rate hike expectations).
- Cautious optimism is warranted: A 50.1 reading is expansion, but it’s fragile. Small businesses are struggling, exports remain weak, and manufacturers are still cutting prices. This is a tentative recovery, not a roaring boom.
What to Watch Next
Traders monitoring China’s economic trajectory and its impact on commodity currencies should keep an eye on:
China’s Q4 GDP report (due January 19, 2026): This will provide broader confirmation of whether the manufacturing stabilization is translating to overall economic growth.
Australia’s next CPI report (due January 28, 2026): A stronger-than-expected core inflation reading, or continued “sticky” levels, could trigger an RBA rate hike at the February 3 meeting, potentially extending the AUD’s rally.
January’s China PMI data (due around January 31, 2026): Can manufacturing hold above 50 for a second consecutive month, or was December a one-off bounce?
Commodity prices: Watch copper, iron ore, and other industrial metals. If China’s manufacturing recovery is genuine, commodity prices should firm, providing additional tailwinds for the Australian and Canadian dollars.
For traders just starting to understand how global economic data connects to currency movements, China’s December PMI offers a textbook example: a barely-above-threshold reading that, when combined with policy stimulus and sticky inflation in a major trading partner, can create meaningful opportunities in forex markets. The lesson? In trading, context matters as much as the numbers themselves.
This article is for educational purposes only. It does not constitute financial advice. Trading involves substantial risk, and past performance is not indicative of future results. Always do your own research and consider consulting with a qualified financial advisor.