2026-01-06 22:33:00
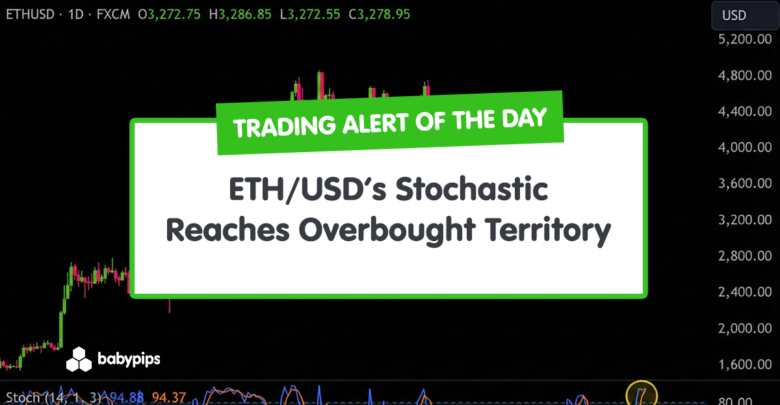
ETH/USD has pushed higher in recent sessions, and momentum has now reached extreme overbought territory on the Stochastic oscillator.
This type of development can sometimes precede a cooling-off phase, especially after a persistent climb from recent lows.
Traders watching for shifts in short-term sentiment may find this a notable juncture to reassess risk and potential scenarios.
Welcome to “TA Alert of the Day.” Each day after the market close, MarketMilk scans for popular technical indicator alerts. We use these alerts as the basis for a mini-lesson, breaking down what each alert means, why it matters, and how traders might interpret it. The goal is to help beginner traders not only spot these alerts but also understand the logic behind them and how they can inform trading decisions.
What MarketMilk Has Detected
The Stochastic (14,3,3) for ETH/USD has risen to 94.29, crossing above the typical overbought threshold near 80.00, indicating stretched upside momentum.
This follows a sustained rebound from late November–early December lows around the 2,620–2,820 area to the current region above 3,200.
Price has also reclaimed and traded above a recent cluster of resistance around 3,000–3,050, an area that capped several sessions in late December.
This overbought reading is emerging after ETH/USD broke away from its late-December consolidation between roughly 2,900 and 3,000 and climbed toward the early-December swing highs near 3,300–3,350.
The combination of price pressing into a prior resistance zone and momentum entering overbought suggests that upside energy is currently elevated and potentially vulnerable to a pause or pullback.
What This Signals
Traditionally, a Stochastic reading above 80, and especially above 90, suggests that bullish momentum is becoming overbought and may be vulnerable to exhaustion.
In this context, the current signal can attract traders looking for a potential short-term reversal or at least a consolidation after the recent advance from the sub-3,000 area.
If the move is not sustained, a rotation back toward nearby supports such as 3,150–3,180 or even the 3,000–3,050 band would be consistent with a typical overbought unwind.
However, this same pattern can also represent strong trend continuation rather than imminent weakness.
In firmly trending markets, Stochastic can remain overbought for extended periods while price grinds higher, with only shallow pullbacks or sideways pauses.
ETH/USD has recently broken out of a multi-week base that formed between roughly 2,800 and 3,000, so overbought momentum here can sometimes coincide with a strong “trend leg” where prices briefly consolidate before attempting to push further through the 3,300–3,350 region.
The outcome depends heavily on how price behaves around nearby resistance and whether overbought conditions are relieved through time (sideways movement) or through price (a deeper pullback).
Context and confirmation are essential: interaction with the 3,000–3,050 support zone, higher-timeframe trend direction on the Weekly chart, and broader crypto risk sentiment will all influence whether this overbought signal precedes a reversal or a continuation phase.
How It Works
The Stochastic oscillator is a momentum indicator that compares the current closing price to the high–low range over a selected lookback period, here 14 bars (in days), and then smooths the result (3,3).
Readings near 0 indicate price is closing near the lower end of its recent range, while readings near 100 show price is closing near the upper end.
Overbought levels (commonly above 80) do not mean price is “too high” fundamentally. Rather, they indicate that, relative to recent price action, buyers have consistently pushed closes toward the top of the range.
Important: Overbought and oversold readings can persist, especially in strong trends, and do not automatically signal an imminent reversal. The Stochastic is best used in combination with price structure, support/resistance, and higher-timeframe context to filter out false signals and avoid reacting solely to a single oscillator reading.
What to Look For Before Acting
Do not assume this overbought Stochastic reading means ETH/USD will immediately reverse lower.
Consider these factors:
- Price action around 3,300–3,350 – Does ETH/USD reject this prior swing-high region with clear bearish candles, or consolidate above it?
- Reaction to nearby support – Watch how price behaves if it retests the 3,150–3,180 zone and, more importantly, the 3,000–3,050 support band from late December.
- Stochastic crossover signals – Look for the %K line to cross below the %D line from overbought territory as added confirmation of potential momentum cooling.
- Higher timeframe alignment – Check the Weekly chart to see if it supports a broader uptrend (making this a possible trend pause) or shows signs of larger-scale exhaustion.
- Structure of the recent climb – Assess whether the rise from ~2,900 to above 3,200 has been smooth and orderly (trend-like) or sharp and parabolic (more prone to snap-backs).
- Broader crypto market tone – Assess whether other major crypto assets are also showing overbought momentum and stalling, or if the broader sector is still breaking higher.
- USD and macro backdrop – For ETH/USD, shifts in USD strength, equity market risk appetite, and interest-rate expectations can influence whether risk assets continue to attract flows.
- News and event risk – Consider upcoming regulatory headlines, macro data, or crypto-specific events that might either reinforce or quickly invalidate a technical overbought setup.
Risk Considerations
⚠️ Overbought can stay overbought. ETH/USD may remain in overbought Stochastic territory while price grinds higher, leading to premature exits or countertrend trades if one reacts too early.
⚠️ False reversal cues near strong trends. In a newly emerging uptrend from the 2,800–3,000 base, shorting solely on an overbought reading can be risky if the broader trend is still building.
⚠️ Support breaks can accelerate losses. If traders position for a modest pullback but price breaks key supports like 3,000–3,050, the move can extend further than anticipated, impacting risk–reward assumptions.
⚠️ Event-driven volatility. Sudden news or macro shifts can override oscillator signals, causing sharp moves that ignore typical overbought “cool-down” behavior.
Potential Next Steps
You may consider adding ETH/USD to your watchlist and closely monitoring how price behaves around the 3,300–3,350 resistance region and the 3,000–3,050 support zone while the Stochastic remains overbought.
Waiting for additional confirmation, such as a Stochastic crossover down from overbought, bearish candle patterns at resistance, or a clear loss of short-term support, can help refine timing and reduce reliance on a single indicator reading.
For those already positioned, this may be a moment to reassess stop-loss placement and position size, ensuring that risk is balanced against both the possibility of a near-term pullback and the alternative scenario of continued trend strength.