2026-01-03 01:29:00
Article Highlights
- A bullish MACD crossover in USD/JPY suggests buyers may be attempting to reassert control after a recent consolidation near highs.
- Price is pausing just below key resistance around 157.70, making follow-through and support behavior critical for confirmation.
- The signal carries whipsaw risk, as momentum shifts near resistance can fail without broader trend and fundamental alignment.
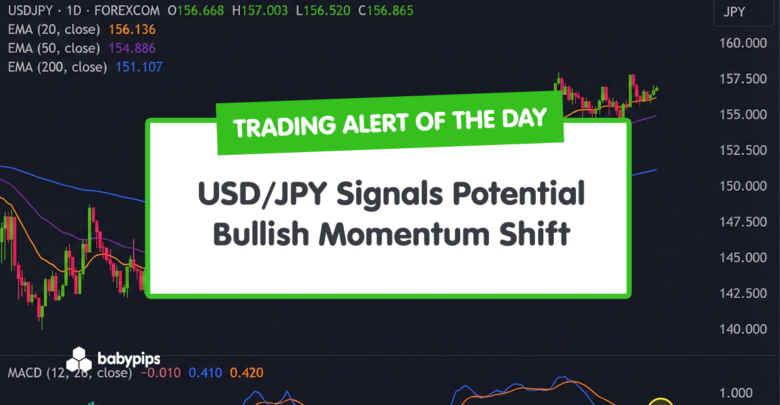
The latest MACD crossover in USD/JPY hints at a possible shift in bullish momentum, even as price action has paused near recent highs.
Traders watching this pair may see this as an early sign that buyers are attempting to reassert control.
Is this bullish MACD crossover in USD/JPY signaling a genuine continuation higher, or is it a potential bull trap near key resistance levels?
How the price reacts around nearby resistance levels will be key to judging the strength of this development.
A strong break and hold above resistance would put the uptrend back in focus, while a rejection could drag the pair back toward lower support zones.
For now, this is a classic “wait and see” moment, where price action, not the indicator alone, will decide the next move.
Welcome to “TA Alert of the Day.” Each day after the market close, MarketMilk scans for popular technical indicator alerts. We use these alerts as the basis for a mini-lesson, breaking down what each alert means, why it matters, and how traders might interpret it. The goal is to help beginner traders not only spot these alerts but also understand the logic behind them and how they can inform trading decisions.
What MarketMilk Has Detected
At market close today, MarketMilk detected that the MACD line has crossed above its Signal line, moving from 0.396874 vs. 0.399934 on the prior bar to 0.404602 vs. 0.400868 on the latest close.
This bullish crossover appears after USD/JPY has climbed from around 150.00–152.00 in early October to the mid‑150s and recently retested the 156.80–157.20 area.
Price is currently consolidating just below the recent swing high near 157.70 from 2025‑12‑18, suggesting a pause within a broader uptrend rather than a clear reversal.
What This Signals
Traditionally, a MACD line crossing above its Signal line is viewed as a bullish momentum cue.
It suggests that short‑term upside momentum is starting to outpace the longer‑term average, which can attract traders looking for continuation of the existing uptrend.
In the current context, this crossover near 156.80, just under resistance around 157.70 and above recent support in the 155.20–155.90 zone, often marks an attempt by buyers to drive another leg higher if the move is sustained.
However, this same pattern can also represent a brief momentum uptick during a broader loss of steam. MACD crossovers near prior resistance, such as the 157.70 high from mid‑December, sometimes coincide with bull traps where prices briefly push or probe higher before fading back into the recent range.
If USD/JPY fails to hold above nearby support levels like 156.00–156.20 after this signal, the crossover could end up being a short‑lived whipsaw rather than the start of a larger move.
The outcome depends heavily on:
- How price behaves around the nearby support/resistance cluster (156.00–157.70).
- The persistence of buying interest after the crossover.
- The confirmation from higher timeframes and related markets, such as broader USD performance and JPY risk‑sentiment dynamics.
How It Works
The MACD (Moving Average Convergence Divergence) is a momentum indicator built from the difference between two exponential moving averages (commonly the 12‑period and 26‑period EMAs).
The MACD line is that difference, while the Signal line is typically a 9‑period EMA of the MACD line itself.
A bullish crossover occurs when the MACD line moves above the Signal line, indicating that recent price gains are accelerating relative to the prior average pace.
Important: MACD is a lagging indicator derived from moving averages, so crossovers often occur after an initial price move has already started. In choppy or range‑bound markets, like the sideways stretches seen in USD/JPY around 155.00–156.00 during December, MACD can generate multiple false crossovers (whipsaws). Context and confirmation from price structure, higher‑timeframe trends, and other tools are essential before acting solely on this signal.
What to Look For Before Acting
Do not assume this MACD crossover automatically means a sustained bullish trend continuation. Consider these factors:
- Price action confirmation – Does USD/JPY break and hold above recent resistance near 157.00–157.70, or does it stall and reverse back into the 156.00–156.20 area?
- Trend context – Is the broader trend (e.g., on the Daily and Weekly charts) still clearly upward, with higher highs and higher lows, or is momentum flattening after the extended rise from the 150.00–152.00 region?
- Support behavior – Does price respect recent support zones around 155.20–155.90 on pullbacks, indicating buyers are defending dips after the crossover?
- Higher timeframe alignment – On the Weekly timeframe, does MACD or other trend indicators support a continuation narrative, or are they showing signs of exhaustion or divergence?
- Potential divergences – Is MACD making higher highs while price fails to set new highs above 157.70, which could hint at weakening follow‑through despite the bullish crossover?
- Volatility conditions – Has volatility compressed around the 156.50–157.00 band, suggesting a potential breakout, or are wide swings pointing to unstable conditions that can exaggerate false signals?
- USD fundamentals – Are upcoming US data releases (e.g., inflation, jobs, Fed‑related commentary) supportive of further USD strength, or could they shift expectations and weigh on the dollar side of USD/JPY?
- JPY and BoJ policy backdrop – Are Bank of Japan comments or yield developments hinting at any shift toward tighter policy or higher domestic yields that might underpin JPY and counter a bullish USD/JPY signal?
- Cross‑asset and risk sentiment – Is global risk sentiment in a risk‑on mode (often pressuring JPY as a safe haven) or risk‑off (which can support JPY and cap USD/JPY rallies)?
- Confluence with other indicators – Do moving averages, RSI, or key trendlines line up with this MACD signal to create a stronger technical confluence, or is MACD acting in isolation?
Risk Considerations
⚠️ Whipsaw risk in ranges. USD/JPY has shown sideways behavior around the mid‑150s during December, and MACD crossovers in such environments can quickly reverse, leading to frequent false entries.
⚠️ Resistance rejection risk. The pair is trading below a recent swing high near 157.70; a failure to clear or hold above this area after the crossover could turn a bullish setup into a sharp pullback.
⚠️ Lagging indicator risk. Because MACD is based on moving averages, by the time a crossover appears, a large portion of the immediate move may already have occurred, skewing reward‑to‑risk if the price is close to resistance.
⚠️ Event and headline risk. USD/JPY is highly sensitive to central bank commentary, yield moves, and macro data; sudden news can override technical signals and trigger gaps or spikes opposite the MACD indication.
⚠️ Over‑reliance on a single signal. Acting solely on one MACD crossover without considering broader market structure, positioning, and correlations can increase the likelihood of misreading the market’s intent.
Potential Next Steps
You may wish to keep USD/JPY on your watchlist, monitoring how the price behaves around the 156.00–156.20 support band and the 157.00–157.70 resistance zone in the sessions following this crossover.
For those considering action, waiting for additional confirmation, such as a sustained break above resistance, a supportive weekly structure, or aligned signals from other indicators, can help filter out potential whipsaws.
Regardless of the approach, position sizing, clearly defined stop levels around recent swing highs/lows, and awareness of upcoming economic and policy events are essential for managing risk around this MACD‑based bullish signal.