2025-12-30 00:44:00
Article Highlights
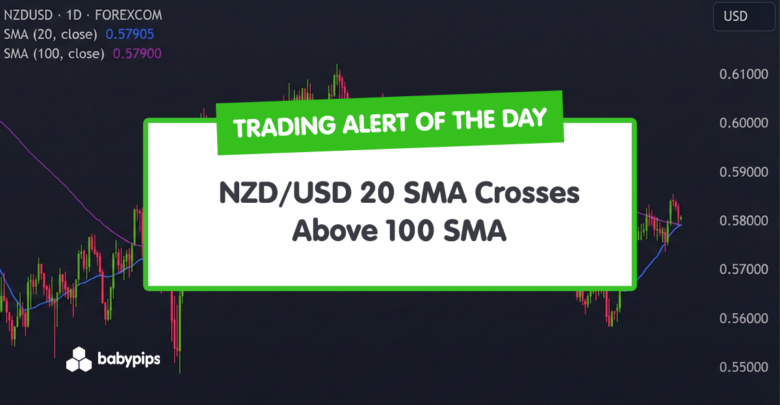
- NZD/USD has triggered an early bullish signal as the 20 SMA crosses above the 100 SMA following a steady recovery from November lows.
- Confirmation depends on price holding higher lows near 0.5730–0.5770 and reclaiming resistance around 0.5835–0.5850.
This kind of moving average crossover often appears after a gradual upside grind.
Traders watching trend strength may see this as an early sign that bullish pressure is starting to gain the upper hand, though confirmation is still needed.
What MarketMilk Has Detected
On market close today, MarketMilk has detected that the 20-period simple moving average (SMA) has crossed above the 100-period SMA, with the prior bar showing the 20 SMA slightly below the 100 SMA (0.578841 vs. 0.579155), and the latest bar now marginally above (0.579218 vs. 0.579020).
This indicates that recent prices have, on average, been climbing faster than the longer-term baseline.
This crossover follows a steady recovery from late-November lows around the 0.5580–0.5610 region toward recent closes near 0.5840–0.5835 before today’s dip to 0.580415.
Along the way, the pair repeatedly respected higher lows around 0.5700–0.5730, forming a rising structure that now underpins this bullish moving average shift.
What This Signals
Traditionally, a 20 SMA crossing above a 100 SMA is viewed as a bullish trend-development signal.
It suggests that recent buying pressure has been strong enough to pull the shorter average above the longer one, and if this move is sustained, it can attract trend-following buyers who look for early-stage uptrend confirmations.
In this context, the crossover reflects the transition from the November downswing (from about 0.581–0.582 down toward 0.558–0.562) into a more constructive, upward-biased phase.
However, this same pattern can also represent a late or fragile signal when markets are consolidating rather than trending.
Short-term averages can whip above and below longer ones in a sideways environment, creating false starts where prices briefly break higher only to rotate back into the prior range.
The current pullback from the 0.5840–0.5850 area, combined with today’s -0.40% decline, shows that bullish momentum is not yet decisive and that a failed crossover (bull trap) remains possible.
The outcome depends heavily on whether NZD/USD can hold above recent higher-low zones (roughly 0.5730–0.5770), how the price behaves around nearby resistance (0.5835–0.5850), and the broader USD and risk-sentiment backdrop.
Context and confirmation are essential before treating this as a durable uptrend signal.
How It Works
The 20 SMA and 100 SMA are simple moving averages that smooth the price over the last 20 and 100 periods, respectively.
When the 20 SMA crosses above the 100 SMA, it means recent prices (the last 20 bars) are, on average, higher than the longer-term 100-bar average, indicating an upswing in the short-term trend relative to the broader baseline.
Traders often use this crossover to gauge whether momentum is shifting from neutral or bearish to more bullish.
Important: Moving average crossovers are inherently lagging signals; they respond after the price has already moved. They tend to work best in trending environments and can produce whipsaws in choppy ranges, especially when the two averages cross multiple times in a short span. Their reliability improves when aligned with supportive price action, higher timeframe trends, and key levels.
What to Look For Before Acting
Do not assume a sustained bullish trend is underway.
Consider these factors:
- Whether price can reclaim and hold above the recent local resistance area near 0.5835–0.5850, turning it into support.
- If pullbacks respect the rising structure of higher lows around 0.5730–0.5770, keeping the nascent uptrend intact.
- How NZD/USD behaves around the 20 and 100 SMAs on retests. Bounces from these averages can add credibility to the crossover.
- Alignment with higher timeframes (e.g., Weekly charts) to see if this crossover is part of a broader upside shift or just noise within a larger downtrend.
- Confirmation from other indicators (such as momentum oscillators or trend measures) that support building bullish momentum rather than overextended conditions.
- Overall volatility conditions. Tight price compressions followed by the crossover may precede a stronger move, while already-elevated volatility can increase whipsaw risk.
- The fundamental backdrop for NZD and USD, including upcoming data (GDP, inflation, employment) and central bank guidance that could reinforce or contradict the technical signal.
- Global risk sentiment. NZD tends to benefit from risk-on environments, while strong risk-off flows typically favor USD and can undermine a bullish NZD/USD crossover.
Risk Considerations
⚠️ Whipsaw risk in range-bound conditions. If NZD/USD remains in a sideways band around 0.5730–0.5850, the 20 and 100 SMAs can cross back and forth, generating misleading trend signals.
⚠️ Lag and late entries. Because the crossover forms after a notable move off the November lows, new entries purely on this signal may face reduced reward-to-risk if price is already near short-term resistance.
⚠️ Failure at resistance. A rejection from the 0.5835–0.5850 area or a deeper drop back toward 0.5700–0.5720 could turn this bullish crossover into a bull trap, catching late buyers.
⚠️ Macro and event risk. Sudden shifts in USD strength (e.g., from surprise Fed communication or data releases) can quickly override this technical setup and reverse price direction.
Potential Next Steps
Traders may choose to keep NZD/USD on their watchlist, monitoring how the price behaves around the 20 and 100 SMAs and the nearby 0.5835–0.5850 resistance area.
Waiting for additional confirmation, such as a higher high above recent peaks, and pullbacks that hold above key support can help filter out potential false signals.
As always, any trade ideas based on this crossover should be paired with clear risk management, including predefined stop levels below recent swing lows and position sizing that accounts for current volatility and upcoming macro events.