2025-12-23 22:42:00
NZD/JPY has closed beyond its typical recent range, indicating it may have moved too far, too fast.
This development comes after a steady multi-week climb from the mid‑80s into the low‑90s.
Traders watching for signs of momentum fatigue or a pullback may find this breach of the upper Bollinger Band particularly noteworthy.
What MarketMilk Has Detected
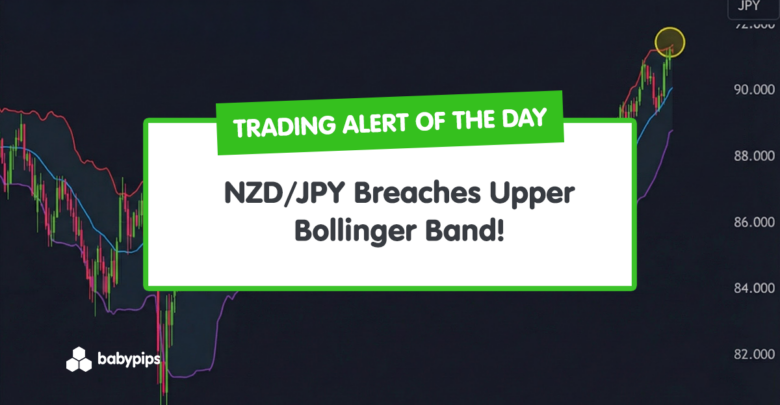
NZD/JPY has closed at 91.242500, slightly above the 20‑period upper Bollinger Band, which currently sits near 91.241696.
This follows a prior close at 90.962500, when the upper band was around 91.283627, showing that price has now “caught up” to and nudged through the band as volatility expanded.
This signal appears in the context of a sustained uptrend from lows near 85.5–86.0 seen in late September and early October, with recent resistance forming around the 90.5–91.0 area.
The pair has been riding the upper half of its Bollinger Bands since late November, with price repeatedly testing and respecting the upper band before this latest close above it.
What This Signals
Traditionally, a close above the upper Bollinger Band after a persistent advance suggests that price may be entering a phase of overextended momentum.
For NZD/JPY, this can attract traders who anticipate mean reversion back toward the middle band (around 89.99), especially with price now trading well above the recent consolidation zone near 89.5–90.0.
If the move above the band fails to build follow‑through, this breach often marks an area where upside momentum slows, and corrective or sideways price action can develop.
However, this same pattern can also represent strong trend continuation, where prices briefly push outside the band as volatility expands in the direction of the prevailing trend.
In a robust uptrend, NZD/JPY can “walk the band,” hugging or repeatedly closing near the upper band while grinding higher, turning what appears to be an overextension into a sustained bullish phase.
In such cases, if you assume an immediate reversal, you may face a grind higher against your position!
The outcome depends heavily on how price behaves around the upper band in the next several sessions and broader risk sentiment affecting NZD and JPY.
Context and confirmation are essential: whether this evolves into a topping area or simply another stepping stone in the uptrend will be clarified by subsequent candles, reactions around 90.5–91.0, and how quickly the price reverts (or fails to revert) back toward the middle band.
How It Works
Bollinger Bands are a volatility‑based indicator constructed from a moving average (the middle band) and two outer bands plotted at a set number of standard deviations above and below that average.
In this case, the 20‑period middle band for NZD/JPY is currently around 89.985875, with the upper band at 91.241696 and the lower band at 88.730054.
When price touches or crosses the outer bands, it indicates that the move is relatively large compared with recent volatility, often highlighting potential overextension or the start of a volatility expansion.
Important: Bollinger Bands measure volatility, not direction. A breach of the upper band does not guarantee a reversal; in strong uptrends, price can remain near or above the upper band for extended periods.
Signals from Bollinger Bands tend to be more informative when combined with trend analysis, key support/resistance levels, and other tools (such as momentum oscillators or price action patterns) rather than used in isolation.
What to Look For Before Acting
Do not assume an immediate bearish reversal.
Consider these factors:
- Follow‑through price action – Does NZD/JPY print rejection candles (long upper wicks) or bearish closes back inside the band in the next 1–3 sessions?
- Distance to the middle band – How fast and how far price pulls back toward the 20‑period average around 90.0, or instead stays pinned near 91.0+?
- Trend context on higher timeframes – On the Weekly charts, is NZD/JPY at a major resistance zone or still mid‑trend with room above recent highs?
- Nearby support and resistance – Watch how price reacts around recent swing highs near 90.8–91.2 and prior support in the 89.5–90.0 region.
- Volatility behavior – Does the band width continue to expand (supporting a strong trend) or start to contract again (supporting a cooling move)?
- Momentum indicators – Are RSI or Stochastic (if you use them) showing overbought momentum or bearish divergence versus the new price highs?
- Cross‑asset and macro context – NZD tends to be supported in risk‑on environments, while JPY often strengthens in risk‑off; how does this move align with broader equity and bond market sentiment?
- Upcoming fundamental events – Monitor New Zealand and Japan economic data releases, as well as central bank communications, that could change volatility or trend direction.
- Session timing and liquidity – Note whether the signal occurred into or out of major sessions (Tokyo, London, New York), as liquidity can affect the reliability of band breaches.
Risk Considerations
⚠️ False reversal risk. An upper band breach can lure traders into early counter‑trend positions, only for the uptrend to resume and price to continue “walking the band.”
⚠️ Volatility expansion risk. Increased volatility after a band breach can lead to larger‑than‑expected swings, potentially hitting stops on both sides before direction becomes clear.
⚠️ Timeframe mismatch. Signals on this timeframe may conflict with longer‑term trends on the weekly chart, creating whipsaw if trades are not aligned with the dominant trend.
⚠️ News‑driven spikes. Sudden macro or policy surprises affecting NZD or JPY can override technical setups, turning a seemingly clean band touch into a sharp continuation move.
Potential Next Steps
Consider adding NZD/JPY to your watchlist to observe how the price behaves around the upper Bollinger Band over the next few sessions.
You can wait for clear confirmation, such as a decisive return inside the bands with bearish candles, or alternatively, strong closes sustaining above recent highs, before acting on a potential reversal or continuation scenario.
Whatever your approach, align any trade ideas with a higher‑timeframe context and employ disciplined risk management, including predefined stop‑loss levels and position sizing that accounts for current volatility.