
2025-12-18 05:44:00
Spot gold is chillin’ like a villain just below the $4,400 psychological mark, right around where the yellow metal hit record highs.
Will gold revisit those highs in the next few trading sessions?
Or will the bears step in and defend the resistance zone for another day?
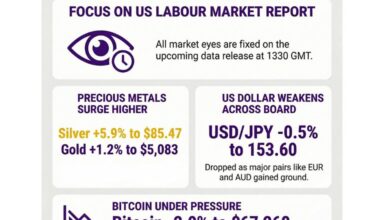
In case you missed it, geopolitical uncertainty and jitters ahead of this week’s central bank decisions and top-tier U.S. data pushed traders toward safe-haven assets like gold.
The U.S. dollar is also seeing some of those safe-haven flows, but U.S. tensions with Venezuela and expectations for Fed rate cuts next year could cap how much demand the Greenback attracts.
Remember that directional biases and volatility conditions in market price are typically driven by fundamentals. If you haven’t yet done your fundie homework on gold and the U.S. dollar, then it’s time to check out the economic calendar and stay updated on daily fundamental news!
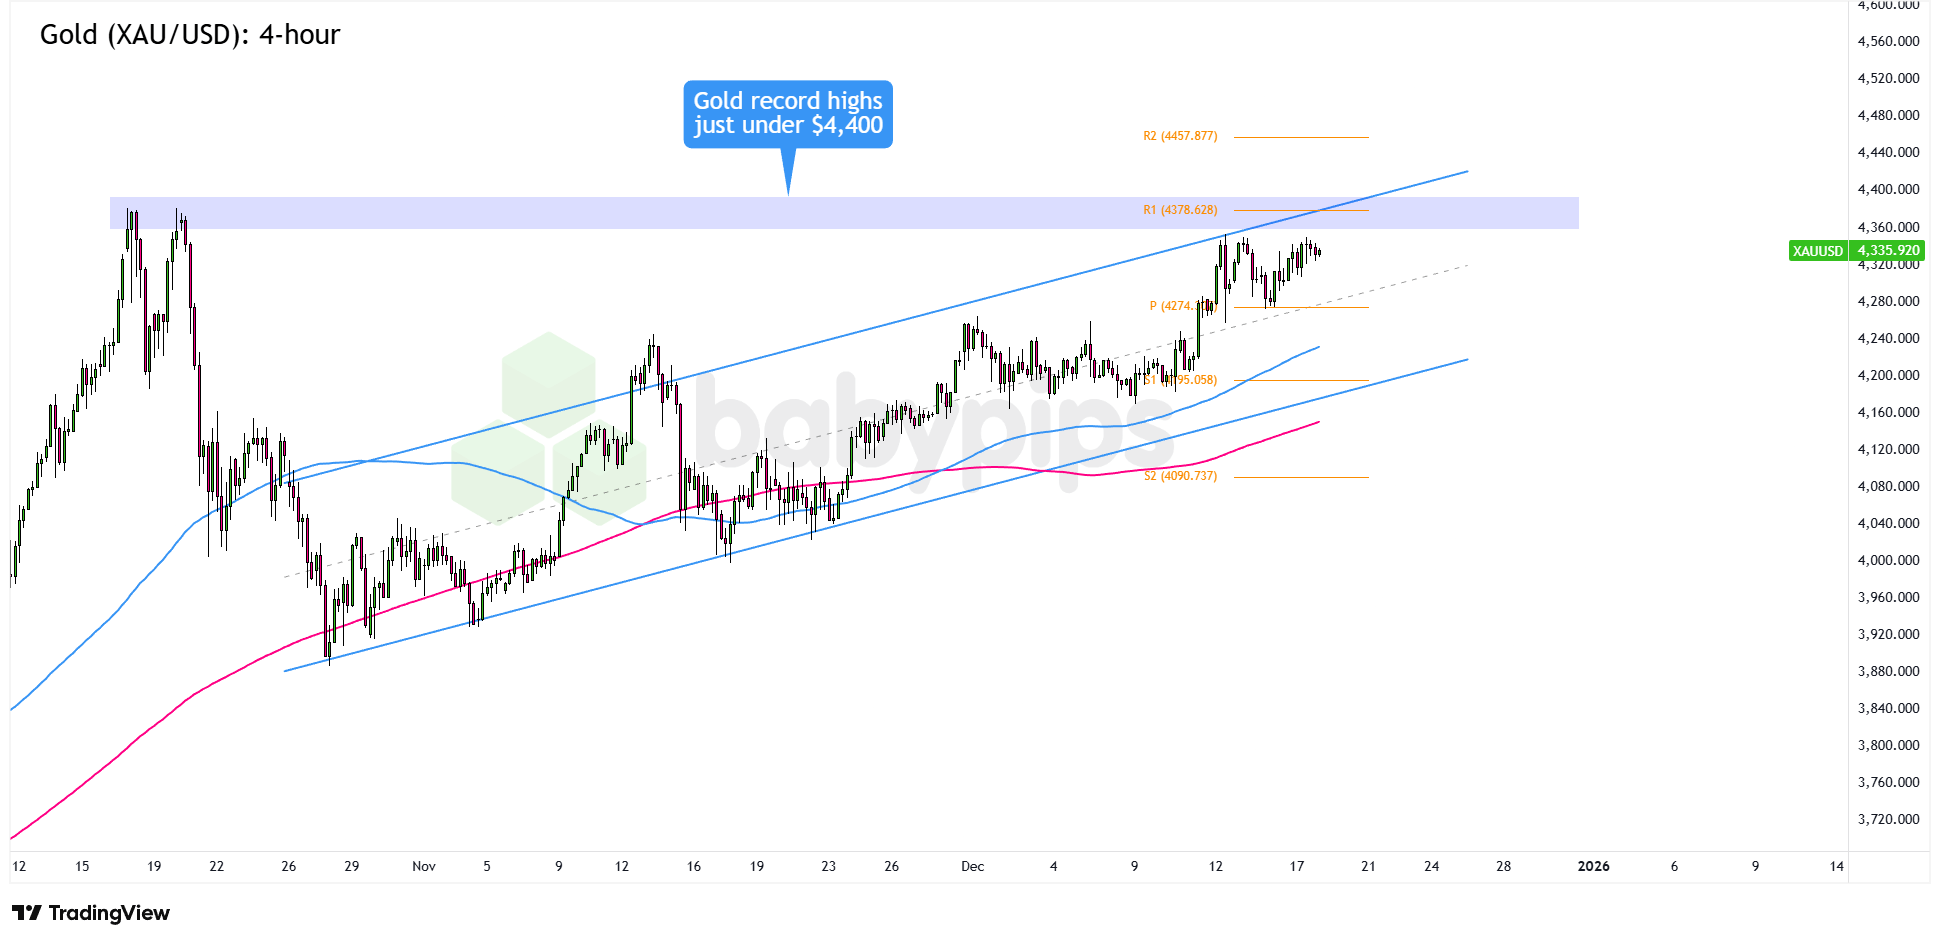
XAU/USD has been putting in higher highs and higher lows since November, but it is starting to struggle as prices push above the $4,350 minor psychological area.
At current levels, gold is running into a familiar wall. Prices are sitting near the R1 Pivot Point at $4,378.63 and pressing up against the top of the ascending channel on the 4-hour chart. Adding to the tension, spot gold is now just a stone’s throw away from its record highs near $4,378, which helps explain the hesitation.
If bearish candlesticks start to show up and prices stay below $4,300, sellers could gain traction and pull gold toward lower inflection points. That puts the $4,275 Pivot Point and mid-channel support on the radar, with a deeper pullback opening the door toward the $4,200 channel lows.
On the flip side, a few more green candlesticks and sustained trading above $4,375 would likely clear the path for fresh record highs. In that scenario, gold could start eyeing higher areas of interest around $4,400 and potentially $4,450.
Whichever bias you end up trading, don’t forget to practice proper risk management and stay aware of top-tier catalysts that could influence overall market sentiment.
Disclaimer:
Please be aware that the technical analysis content provided herein is for informational and educational purposes only. It should not be construed as trading advice or a suggestion of any specific directional bias. Technical analysis is just one aspect of a comprehensive trading strategy. The technical setups discussed are intended to highlight potential areas of interest that other traders may be observing. Ultimately, all trading decisions, risk management strategies, and their resulting outcomes are the sole responsibility of each individual trader. Please trade responsibly.


