2025-12-17 14:13:00
Key Takeaways
-
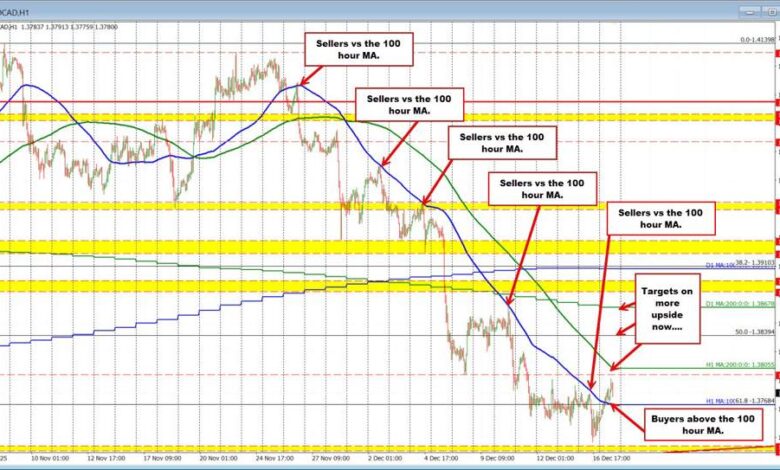
100-Hour MA Breach: For the first time since late November, USDCAD buyers have pushed the price above the 100-hour moving average (1.3768), snapping a streak of 5 failed attempts.
-
The Next Major Hurdle: The recovery is facing stiff resistance near the 1.3800 level and the falling 200-hour moving average (1.38055).
-
Neutral Bias: While the immediate bearish grip has loosened, the technical bias is currently neutral as the pair trades between the 100-hour and 200-hour moving averages.
-
Upside Targets: A break above 1.3805 opens the door toward the 50% midpoint at 1.38394 and the 200-day moving average at 1.38678.
-
Critical Support: If the breakout fails, traders will eye the key support floor between 1.3720 and 1.3726.
The Bearish Trend Takes a Pause: Breaking the 100-Hour Moving Average
For the past several weeks, the USDCAD pair has been locked in a disciplined downtrend, guided strictly by technical indicators. Specifically, the 100-hour moving average has acted as a rigid ceiling. Going back to November 26, the price tested this moving average on 5 separate occasions.
In each of those previous instances, willing sellers stepped in to defend the level, keeping the bias firmly to the downside. This relentless selling pressure kept dip buyers on the defensive as the price trended lower and lower.
However, the price action today marks a potential shift in character. USDCAD has finally extended above that 100-hour moving average, which currently comes in at 1.3768. The pair stretched to a session high of 1.3795 so far, signaling that the sellers’ grip is loosening.
Step 1 Complete, Step 2 Awaits: The Battle at 1.3800
While the move above the 100-hour MA is a victory for the bulls (“Step 1”), they have not yet won the war. The rally has stalled ahead of the next critical technical cluster: the 1.3800 natural resistance level and the falling 200-hour moving average at 1.38055.
For buyers to gain genuine control and force sellers to cover their positions, the price must break—and stay—above this 200-hour moving average. Until that “Step 2” is achieved, the market remains in a state of limbo. The buyers have managed to neutralize the short-term bearish trend, but they haven’t yet generated enough momentum to confirm a bullish reversal.
Consequently, the current bias is neutral. The pair is trading in the zone between the two moving averages, with the 100-hour MA providing support below and the 200-hour MA providing resistance above.
Bullish Scenario: Upside Targets to Watch
If the buyers can muster the strength to break above the 200-hour moving average (1.38055), it would trigger a more significant technical breakout.
-
Target 1: The first upside objective would be the 50% midpoint of the move up from the June low, located at 1.38394.
-
Target 2: Beyond that, the focus would shift to the longer-term 200-day moving average at 1.38678.
Bearish Scenario: Protecting the Support Floor
Traders must also be wary of a “false breakout.” If the price fails to sustain its momentum and rotates back below the 100-hour moving average at 1.3768, the short-term bullish case would collapse.
In that scenario, sellers would likely retarget the critical support floor established in August and September, located between 1.3720 and 1.3726. This area is proving to be a tough nut to crack; just yesterday, the price dropped within 3 pips of this zone before stalling and bouncing, as buyers leaned heavily against this long-term floor. A return to this level – and below – would put the bears back in the driver’s seat and have traders reigniting the trend to the downside.