
2025-11-07 01:57:00
Is the trend still our friend on EUR/USD?
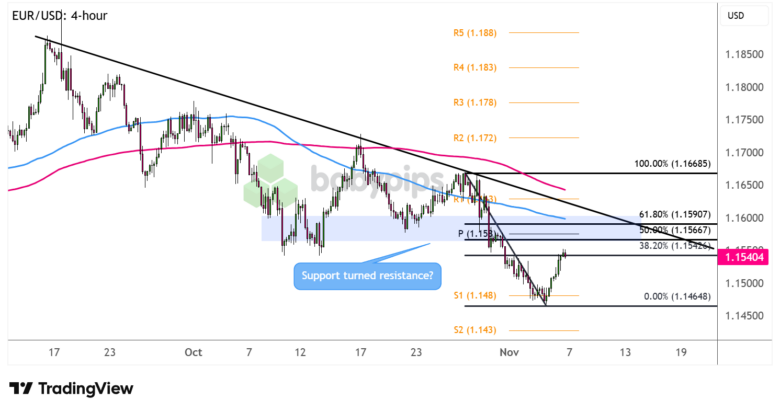
The pair seems to be in correction mode and is approaching an area of interest visible on its 4-hour time frame.
Check out these confluence of technical levels on the potential resistance zone.
In the absence of official U.S. data due to the government shutdown, traders have been dissecting employment reports from private firms pretty closely to gauge whether the labor market is healthy or not.
Underlying figures from the ADP report, the jobs component of the ISM services PMI, and the Challenger job cuts data all seem to be painting a dismal picture, keeping hopes for a December Fed rate cut in play and weighing on USD.
Or will dollar bulls return when EUR/USD tests the area of interest at 1.1600?
Remember that directional biases and volatility conditions in market price are typically driven by fundamentals. If you haven’t yet done your homework on the U.S. dollar and the euro, then it’s time to check out the economic calendar and stay updated on daily fundamental news!
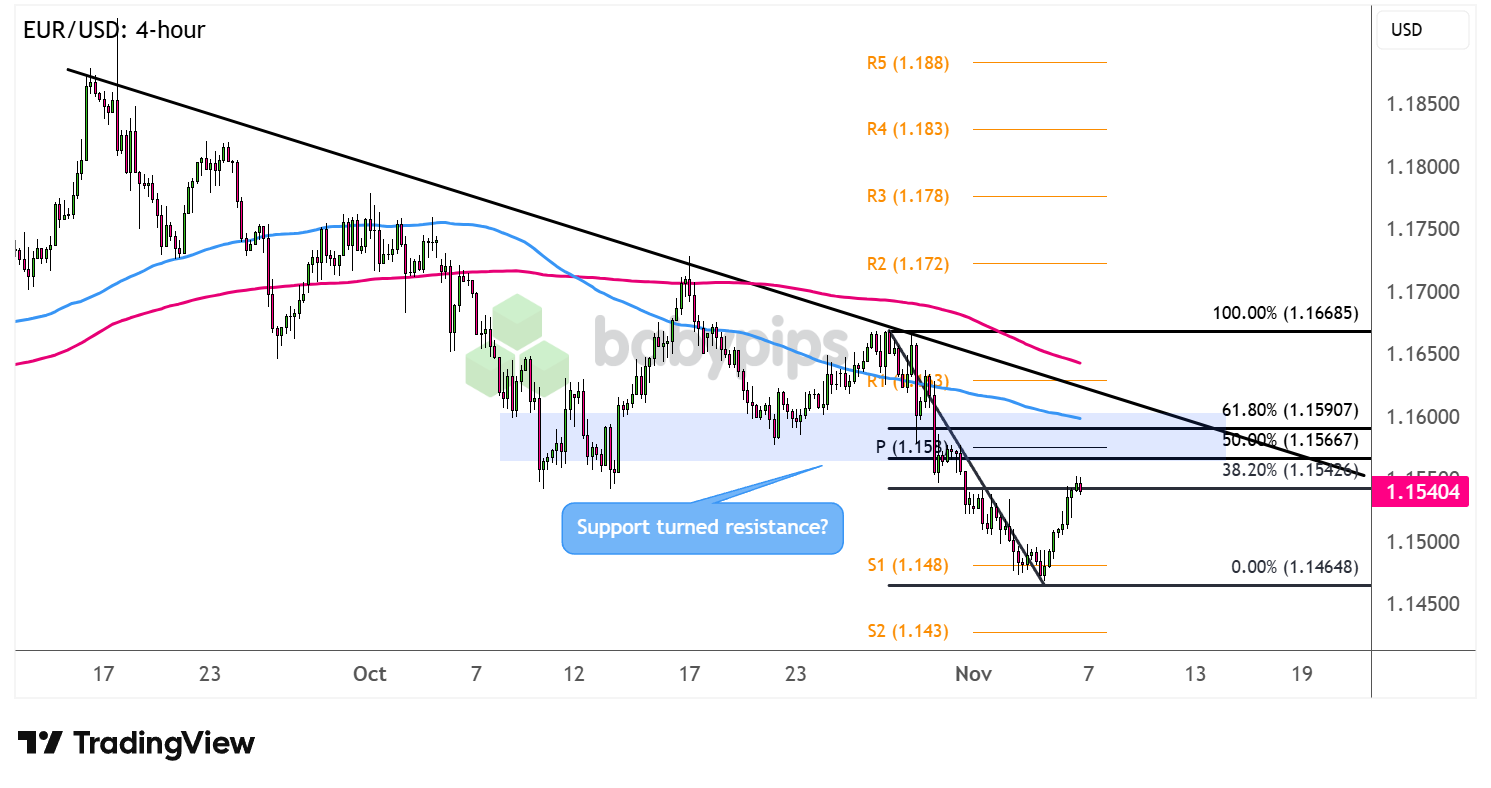
EUR/USD has been forming lower highs connected by a descending trend line that has held as resistance since mid-September, and it looks like another test could be in the works.
Price is hovering around the 38.2% Fibonacci retracement level and could still go for a higher correction to the 50% Fib that’s closer to the pivot point (1.1530) and broken support zone. A larger pullback could reach the 61.8% level near the trend line, which could be the line in the sand for a bearish retracement.
Keep your eyes peeled for reversal candlesticks at any of these areas, as a continuation of the downtrend could take EUR/USD back down to the swing low at S1 (1.1480) or to fresh lows at S2 (1.1430).
On the other hand, long green candlesticks piercing through the resistance zone could hint that a major reversal from the selloff is in order. In this case, watch out for a possible move to R2 (1.1720) then R3 (1.1780) next!
Whichever bias you end up trading, don’t forget to practice proper risk management and stay aware of top-tier catalysts that could influence overall market sentiment!
Disclaimer:
Please be aware that the technical analysis content provided herein is for informational and educational purposes only. It should not be construed as trading advice or a suggestion of any specific directional bias. Technical analysis is just one aspect of a comprehensive trading strategy. The technical setups discussed are intended to highlight potential areas of interest that other traders may be observing. Ultimately, all trading decisions, risk management strategies, and their resulting outcomes are the sole responsibility of each individual trader. Please trade responsibly.