تكنلوجيا اليوم
2025-11-06 17:47:00
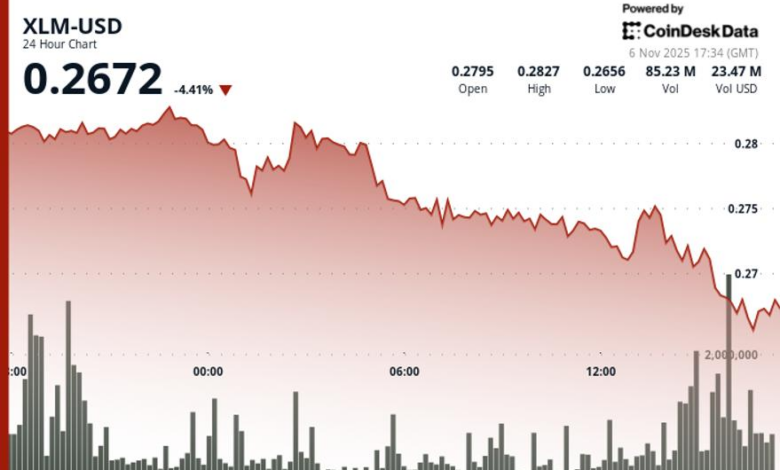
Stellar (XLM) extended its recent slide on Tuesday, falling 2.2% from $0.2789 to $0.2727 as resistance at $0.2815 once again capped upside momentum. The token traded within a $0.0124 range, reflecting 4.5% intraday volatility, while a series of lower highs confirmed the prevailing bearish bias. Support remains near $0.2709, bolstered by repeated tests of the psychological $0.27 level.
Trading volume spiked to 42.6 million tokens at the $0.2815 resistance zone, a 62% jump above the 24-hour moving average. The surge coincided with institutional selling pressure that rejected further gains and signaled a potential distribution phase. This combination of rising volume and price rejection reinforced the dominance of sellers and underscored waning bullish conviction.
On the 60-minute chart, a brief recovery attempt between $0.2720 and $0.2755 during early afternoon trading gave way to a sharp reversal minutes later. The failed breakout triggered a swift drop to $0.2724, accompanied by more than 1 million tokens in sell-side volume within a three-minute window. The pattern confirmed a false breakout scenario and the continuation of the broader downtrend.
As trading momentum faded into the close, overall volume contracted to just 18% of the session average, highlighting depleted buying interest. Without a fresh catalyst or a volume-backed breakout above $0.2815, XLM remains vulnerable to further downside pressure, with short-term traders eyeing the $0.2709 support level as the next key test.
Support/Resistance Analysis:
- Primary resistance is at $0.2815 with volume-confirmed seller interest.
- Support zone holds around $0.2709–$0.2720 after multiple successful tests.
- The psychological $0.27 level provides a temporary floor amid session volatility.
Volume Analysis:
- Peak trading of 42.6M tokens marked the resistance rejection point.
- Heavy selling pressure topped 1M tokens during the afternoon reversal.
- Volume collapse to 18% of average confirms momentum deceleration.
Chart Patterns:
- A downtrend is established through consecutive lower highs formation.
- A false breakout pattern was completed within a 60-minute timeframe.
- A reversal candle confirms institutional distribution at resistance.
Targets & Risk Management:
- Immediate support target sits at the $0.2720 zone based on recent action.
- A break below $0.2709 accelerates the decline toward the next technical level.
- Resistance remains firm at $0.2815 until a volume-backed breakout emerges.
Disclaimer: Parts of this article were generated with the assistance from AI tools and reviewed by our editorial team to ensure accuracy and adherence to our standards. For more information, see CoinDesk’s full AI Policy.