تكنلوجيا اليوم
2025-11-05 03:29:00
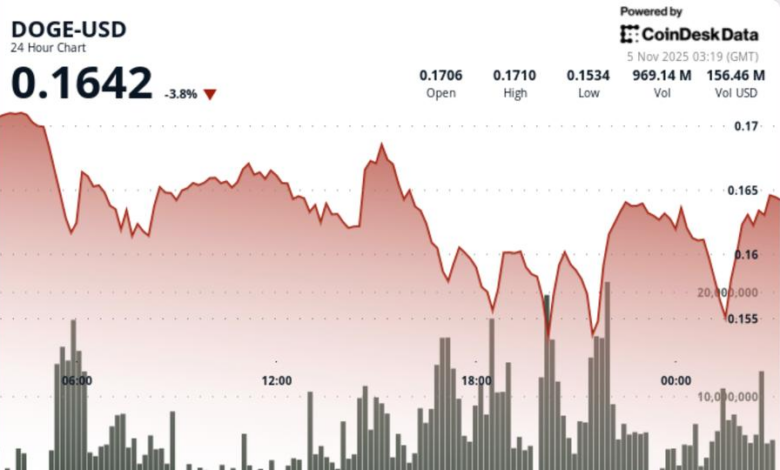
Dogecoin tumbled through major support zones on Tuesday, with heavy whale distribution and surging volume confirming institutional-led selling pressure as traders struggled to defend the $0.16 handle.
News Background
- DOGE fell 5% to $0.16, breaking below critical support after an early-session failure to hold the $0.18 psychological level.
- The token traded within a volatile $0.0185 range, with selling pressure intensifying throughout the day.
- The steepest declines hit at 20:00 GMT, when trading volume spiked to 2.05 billion tokens — 94% above the daily average — as price sliced through the $0.1590 floor. The move reflected broad institutional distribution, corroborated by on-chain data showing $440 million in DOGE outflows from large-holder wallets.
- DOGE reached a session low of $0.1528 before stabilizing near $0.1550, where dip-buying emerged. Recovery attempts were capped at $0.1700, confirming resistance near prior support zones.
Price Action Summary
- A sharp V-shaped rebound appeared on short-term charts following the breakdown.
- However, the bounce failed to sustain momentum, with price consolidating below $0.1620 as overhead resistance from the breakdown level held firm.
- The late-session stabilization indicated temporary exhaustion among sellers but did not yet signal trend reversal.
- Volume skew remained bearish, with selling activity still dominating aggregate flow data across major exchanges.
Technical Analysis
- DOGE continues to trade in a lower-highs, lower-lows formation, maintaining clear bearish momentum within a broader descending structure.
- The brief oversold rebound remains corrective rather than directional, with the overall pattern resembling a classic breakdown–pause sequence typical of distribution cycles.
- Momentum oscillators remain negative across hourly timeframes, while the daily RSI has yet to recover from sub-40 levels.
- Traders note that structural improvement would require sustained closes above $0.1650, invalidating the existing descending pattern.
What Traders Should Know
- Traders are closely watching the $0.1550–$0.1555 area, which continues to act as short-term support.
- A breakdown below this zone would expose $0.1520–$0.1500, where deeper liquidity pools exist from prior accumulation phases.
- Conversely, recovery above $0.1630–$0.1650 is necessary to challenge the broken $0.1590 resistance and signal potential short-term relief.
- For now, intraday action suggests ongoing distribution with limited momentum for sustainable upside follow-through.