A sharp reversal in crude oil prices drove a broad risk-on shift on Monday, with equities rallying, Treasury yields declining, and the US dollar sliding to its worst daily performance among the major currencies, as diplomatic efforts to ease the Strait of Hormuz shipping crisis offered markets a partial reprieve from the geopolitical anxiety that had dominated last week.
Sentiment was potentially further supported by stronger-than-expected Chinese activity data and by US officials signaling that Iranian oil shipments remain permitted and that energy prices are expected to normalize in the months ahead. With the Federal Reserve widely expected to hold rates unchanged at its meeting this week, traders appeared willing to pare down some of their most defensive positioning heading into the policy decision.
Check out the forex news and economic updates you may have missed in the latest trading session!
Forex News Headlines & Data:
- US President Donald Trump stated that Washington is pressing other nations to help secure the Strait of Hormuz and is in discussions with several countries about policing the waterway; he also reiterated that striking oil infrastructure on Kharg Island remains on the table if attacks on shipping continue
- New Zealand Services NZ PSI for February 2026: 48.0 (50.7 forecast; 50.9 previous)
- New Zealand Electronic Retail Card Spending for February 2026: 1.5% y/y (1.0% y/y forecast; 0.4% y/y previous)
- China Retail Sales for February 28, 2026: 2.8% y/y (1.1% y/y forecast; 0.9% y/y previous)
- China Unemployment Rate for February 2026: 5.3% (5.1% forecast; 5.1% previous)
- China Industrial Production for February 28, 2026: 6.3% y/y (5.0% y/y forecast; 5.2% y/y previous)
- Canada Housing Starts for February 2026: 250.9k (230.0k forecast; 238.0k previous)
- Canada CPI Growth Rate for February 2026: 1.8% y/y (2.1% y/y forecast; 2.3% y/y previous); 0.5% m/m (0.9% m/m forecast; 0.0% m/m previous)
- NY Empire State Manufacturing Index for March 2026: -0.2 (3.0 forecast; 7.1 previous)
- U.S. Industrial Production for February 2026: 0.2% m/m (0.3% m/m forecast; 0.7% m/m previous); 1.4% y/y (2.1% y/y forecast; 2.3% y/y previous)
- U.S. Manufacturing Production for February 2026: 1.3% y/y (2.0% y/y forecast; 2.4% y/y previous); 0.2% m/m (0.2% m/m forecast; 0.6% m/m previous)
- U.S. NAHB Housing Market Index for March 2026: 38.0 (36.0 forecast; 36.0 previous)
Promotion: Use TradeZella’s AI Powered trade journal to deep-dive into your execution and see exactly how you performed during today’s trading session.
Click here to get the TradeZella Edge and use code PIPS20 to save 20% on your first purchase!
Disclosure: We may earn a commission from our partners if you sign up through our links, at no extra cost to you.
Broad Market Price Action:
Dollar Index, Gold, Oil, S&P 500, U.S. 10-yr Yield, Bitcoin Overlay – Chart Faster With TradingView
Monday’s broad market session was defined by a dramatic reversal in crude oil, which gapped higher at the Asian open before sliding sharply throughout the day, easing inflation fears and supporting a recovery in equities and fixed income.
WTI crude oil was the session’s most dramatic mover, closing near $91.90 down approximately -5.20% on the day. The individual WTI chart shows price opening in the high $97s during Asian trading, reflecting the weekend escalation following US strikes on Iran’s Kharg Island, before rolling over heading into the London session. The selloff accelerated as reports emerged of diplomatic efforts to restore shipping through the Strait of Hormuz, alongside signals from Treasury Secretary Bessent that Iranian oil exports remain permitted and that prices are expected to ease. WTI continued lower through the US session, settling in the low $92s and unwinding a significant portion of the prior week’s geopolitical risk premium.
The S&P 500 closed near 6,695, up approximately 1.13% on the day. Prices rose steadily from Asian hours through the early London session before pulling back toward the 6,648-6,675 support area around the US open. From there, equities rallied sharply through the morning session, pushing toward the 6,730 resistance area before fading slightly and consolidating into the close. Technology shares led the advance, and the broad gains appeared consistent with the session’s improving risk tone as oil retreated and inflation concerns temporarily eased.
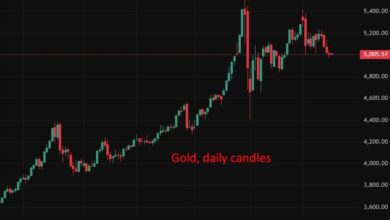
Gold closed near $5,013, down a marginal 0.11% on the day, masking a volatile intraday journey. The market swung between approximately $4,968 on the low end and the $5,036-5,038 area at the highs, with sharp moves in both directions during London and early US trading hours. The near-flat close likely reflected competing forces, with reduced inflation-hedge appeal from falling oil prices possibly offset by lingering safe-haven demand given the unresolved Middle East conflict.
Bitcoin climbed to close near $74,032, up approximately 1.65% on the day. We saw early push toward the $74,400 resistance area during Asian hours, a pullback into the $73,000-73,200 zone during the London session, and then a renewed attempt at the $74,400-74,548 resistance cluster around the US open before consolidating sideways through the afternoon. Bitcoin’s gains appeared broadly consistent with the session’s risk-on tone; no major crypto related news appeared during the session.
The 10-year US Treasury yield fell approximately 5 basis points to settle near 4.229%, down roughly 1.15% on the day. Yields declined from around 4.280% in Asian trading, with the move accelerating through the London session and continuing after the US open. The decline appeared to reflect the market’s recalibration of near-term inflation expectations as oil retreated from multi-year highs, with analysts noting that the extreme rate-cut repricing seen last week was beginning to partially reverse. Several major Wall Street firms had shifted their Federal Reserve rate-cut forecasts to September from June following last week’s oil surge, and the retreat in crude likely allowed some of that positioning to unwind. The Fed is widely expected to hold its overnight lending rate target unchanged at the conclusion of this week’s meeting.
Promoted: Capitalize on News Catalysts Without Risking Your Own Funds.
In a geopolitical shock regime, the S&P 500 can swing 200+ points intraday. Why risk your personal capital during extreme volatility?
Most proprietary firms terminate your evaluation account if you execute a trade during a major macroeconomic release, but FundedNext permits news trading across all models. Test your thesis with up to $200,000 in simulated capital, or take advantage of their Free Trial to experience the platform risk-free.
Explore FundedNext and Start Your Free Trial!
Disclosure: We may earn a commission from our partners if you sign up through our links.
FX Market Behavior: U.S. Dollar vs. Majors
Overlay of USD vs. Majors – Chart Faster With TradingView
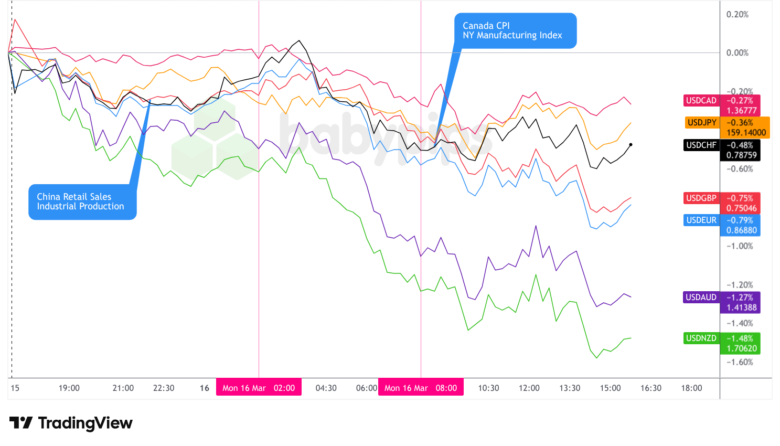
The US dollar closed as the worst performing currency among the majors on Monday, posting broad-based losses across all tracked pairs as risk sentiment improved and oil prices retreated, reducing some of the safe-haven and inflation-driven support that had been underpinning the greenback in recent sessions.
During the Asian session, the dollar traded net lower from the open and moved mostly sideways heading into the London session. The overlay chart shows all USD pairs drifting modestly lower from the start of the session with no sharp directional catalyst visible on the chart. The drift coincided loosely in timing with the release of China’s February activity data, which delivered substantial beats on retail sales (2.8% year-over-year versus 1.1% forecast) and industrial production (6.3% year-over-year versus 5.0% forecast), though the property sector remained under pressure with house prices continuing their prolonged multi-year decline. The stronger Chinese data may have supported risk appetite and encouraged some rotation away from safe-haven dollar positions, though the Asia session moves were relatively contained across the board.
During the London session, the dollar traded net lower against major currencies and continued to do so through the US equity open. The overlay chart shows a clear and broad acceleration lower across most USD pairs from the early European hours, with the declines becoming more consistent and pronounced as the session developed. Falling oil prices were possibly a contributing factor, as the retreat in crude reduced the inflation risk premium that had been supporting the greenback. Canada’s February CPI, which printed at 1.8% year-over-year against a 2.1% forecast and well below January’s 2.3% reading, reinforced a broader disinflationary tone and may have added to the dollar’s downward pressure during this period. The Canadian dollar itself posted a relatively muted gain against the USD compared to other majors, likely reflecting the oil-linked headwinds that tend to complicate CAD’s upside when crude falls sharply.
From the US equity open, the dollar traded mostly sideways and choppy but did see a final push lower ahead of the session close, consistent with the day’s established bearish trend. The US data calendar was mixed but generated limited directional reaction in the greenback. The Empire State Manufacturing Index came in at -0.2 for March, well below the 3.0 consensus and down from 7.1 in February, though subcomponent detail showed new orders and employment holding up while shipments softened. US industrial production met expectations at 0.2% month-over-month, and the NAHB housing sentiment index ticked up to 38, beating the 36 forecast, though it remained well below the 50 neutral threshold for a 22nd consecutive month. With broader risk sentiment and the oil narrative remaining the dominant force, the data appeared to offer little new directional impulse for the dollar.
Upcoming Potential Catalysts on the Economic Calendar
- New Zealand Food Price Index for February 2026 at 9:45 pm GMT
-
Australia RBA Interest Rate Decision for March 17, 2026 at 3:30 am GMT
- Australia RBA Press Conference at 4:30 am GMT
- Japan Tertiary Industry Activity Index for January 2026 at 4:30 am GMT
- Swiss Producer & Import Prices for February 2026 at 7:30 am GMT
- Germany ZEW Economic Sentiment Index for March 2026 at 10:00 am GMT
- U.S. ADP Employment Change Weekly for February 28, 2026 at 12:15 pm GMT
- NY Fed Services Activity Index for March 2026 at 12:30 pm GMT
- New Zealand Global Dairy Trade Price Index for March 17, 2026
- U.S. Pending Home Sales for February 2026 at 2:00 pm GMT
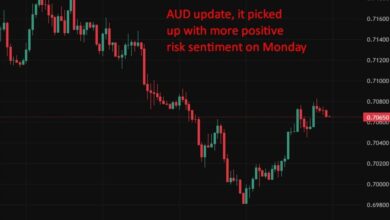
Tuesday’s session is headlined by the Reserve Bank of Australia’s interest rate decision, which will be closely watched for any shift in guidance amid a complex global backdrop that now includes sharply lower oil prices, an uncertain trade environment, and evolving Middle East risk. The decision is followed immediately by a press conference, making it a potential source of significant AUD volatility early in the Asian session.
In Europe, Germany’s ZEW Economic Sentiment Index will provide a read on investor confidence following the ongoing conflict in the Middle East and its implications for European energy security. In North America, the weekly ADP employment change will be monitored for labor market signals ahead of the FOMC statement, while US pending home sales will offer a window into housing sector health.
Markets will also continue to closely track any geopolitical developments in the Middle East, with the Federal Reserve’s policy announcement on Wednesday — widely expected to be a hold — likely keeping broader price action relatively contained as traders await Chair Powell’s press conference and the updated Summary of Economic Projections.
Stay frosty out there, forex friends!
Promoted: Day traders & Scalpers have better odds of making great decisions if they see market catalysts right away. Get the real-time feed that pros use to catch the news.
Join FinancialJuice for Free to learn more!
Disclosure: We may earn a commission from our partners if you sign up through our links, at no extra cost to you.