2026-03-12 03:44:00
Bitcoin appears to be stuck in another holding pattern, but it’s daily time frame reveals that the longer-term trend could still carry on.
Are we about to see a major pullback or a breakdown?
Check out these potential inflection points!
Bitcoin appears to have flip-flopped between trading as “digital gold” and a risk asset, leaving price stuck inside a range since last month.
Still, the emergence of slightly higher lows suggests that bullish pressure could be building, potentially taking BTC/USD to the next upside barriers.
Are the Fib retracement levels about to hold as resistance though?
Remember that directional biases and volatility conditions in market price are typically driven by fundamentals. If you haven’t yet done your fundie homework on bitcoin and the U.S. dollar, then it’s time to check out the economic calendar and stay updated on daily fundamental news!
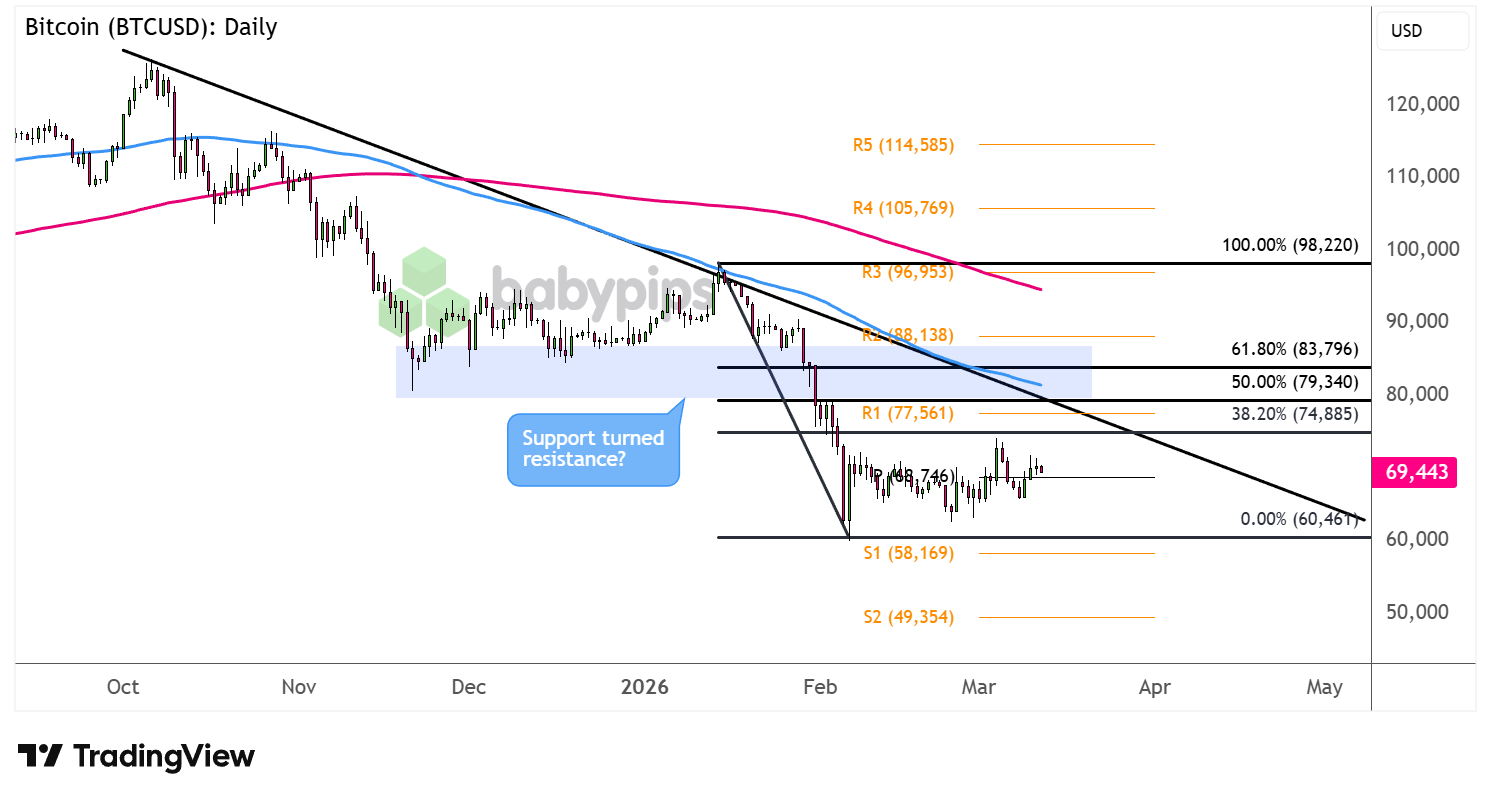
BTC/USD is closing in on the 38.2% Fibonacci level ($74,885) and could still go for a higher pullback to the 50% Fib closer to R1 ($77,561) or the 61.8% retracement near the longer-term falling trend line.
Now this happens to line up with a former support zone around the $84-85K area that could hold as a ceiling moving forward. This region is also right around the 100 SMA dynamic resistance, which is below the 200 SMA to suggest that the downtrend could carry on.
Look out for reversal candlesticks at these upside barriers, as a continuation of the slide could take bitcoin back down to the swing low at $60,461 or to the next potential bearish target at S1 ($58,169).
On the other hand, long green candles busting through the trend line could point to a long-term reversal, possibly lifting BTC/USD to R2 ($88,138) then R3 ($96,953).
Whichever bias you end up trading, don’t forget to practice proper risk management and stay aware of top-tier catalysts that could influence overall market sentiment.
Promoted: The Analysis & Strategy are only half the Battle; Your Mindset is the Rest.
Today’s chart art zooms in on Bitcoin’s longer-term downtrend. But as any pro will tell you, even the cleanest trend-following setup can fall apart if the trader doesn’t stay disciplined when price starts testing the level.
In “Unknown Market Wizards,” Jack Schwager interviews successful traders to reveal a common truth: their edge isn’t just knowledge or skills—it’s their psychological resilience and rigid risk control. Whether you’re navigating tariff shocks or safe haven flows into the franc, learn how the “wizards” stay clinical when the rest of the market is emotional.
Master Your Trading Mindset with the Unknown Market Wizards book on Amazon!
Disclosure: We may earn a commission from our partners if you sign up through our links, at no extra cost to you.
Please be aware that the technical analysis content provided herein is for informational and educational purposes only. It should not be construed as trading advice or a suggestion of any specific directional bias. Technical analysis is just one aspect of a comprehensive trading strategy. The technical setups discussed are intended to highlight potential areas of interest that other traders may be observing. Ultimately, all trading decisions, risk management strategies, and their resulting outcomes are the sole responsibility of each individual trader. Please trade responsibly.

