BTC price stuck under $70,000 as investors play it safe before U.S. inflation report: Crypto Daybook Americas

By Omkar Godbole (All times ET unless indicated otherwise)
Bitcoin slipped back below $70,000 as war in the Middle East and U.S. inflation data due later today keep investors cautious.
The latest failure to build momentum above $70,000 followed reports that Iran was laying mines along the already disrupted Strait of Hormuz, a major global oil chokepoint. Bullish momentum weakened late Tuesday after U.S. Energy Secretary Chris Wright said in a now-deleted social media post that the U.S. escorted an oil tanker through the strait.
As usual, the disappointment quickly spread from bitcoin to the broader crypto market. Major cryptocurrencies such as ether (ETH), solana (SOL), XRP (XRP), and BNB lost 1% or more since midnight UTC, tracking losses in bitcoin. The CoinDesk 20 Index is also down 1% to 1,980 points.
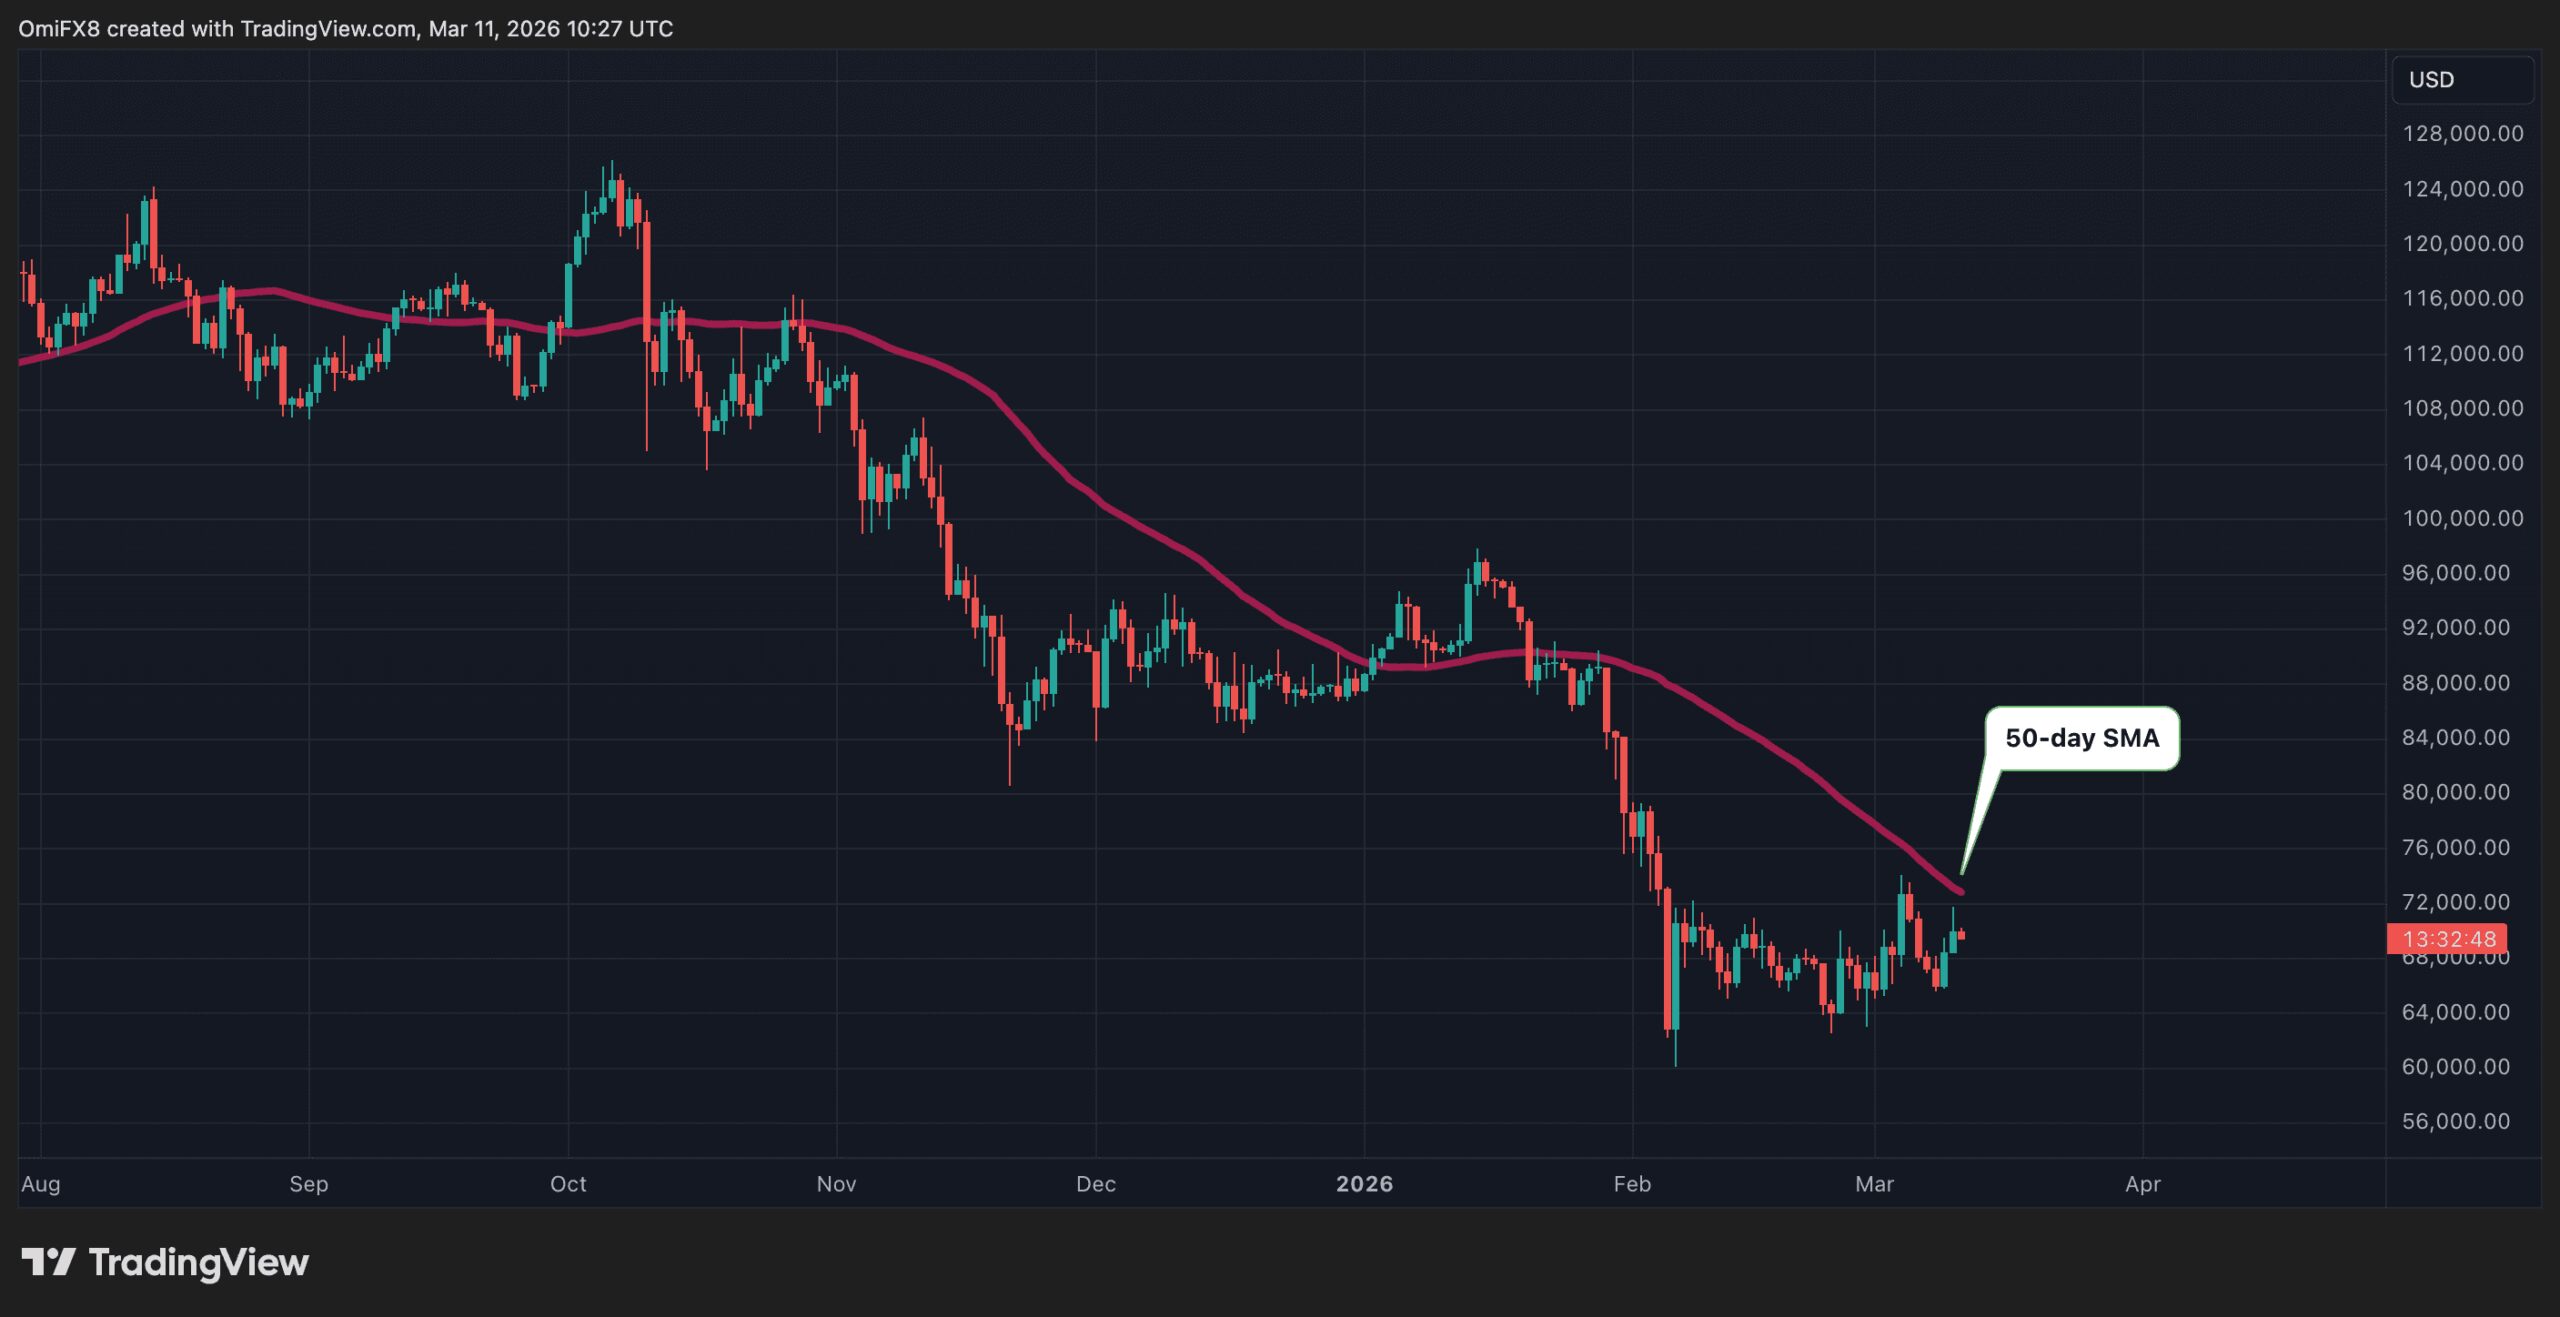
According to Alex Kuptsikevich, chief market analyst at FXPro, traders should closely track the 50-day simple moving average of bitcoin’s price.
“In the short term, the 50-day moving average has proved a formidable resistance level, preventing bulls from swiftly turning the tide in their favor. This indicator often signals the medium-term trend, and a confident break above it would be an important turning point in the coming days,” he said in an email.
Meanwhile, analysts at Bitfinex said the next moves largely depend on oil prices, U.S. government bond yields and Fed policy.
Speaking of the Fed, its members will closely watch the February U.S. consumer price index report due later Wednesday. It is expected to show the inflation rate ticked up to 2.5% year-on-year from January’s 2.4%, according to FactSet. Core inflation, which excludes food and energy, is also seen rising 2.5%.
A higher-than-expected figure, against already resurging war-led inflation fears, could embolden hawks at the Fed and validate expectations of no rate cuts this year. That, in turn, could breed market volatility. Stay alert!
Read more: For analysis of today’s activity in altcoins and derivatives, see Crypto Markets Today
What to Watch
For a more comprehensive list of events this week, see CoinDesk’s “Crypto Week Ahead”.
- Crypto
- Macro
- March 11, 7:30 a.m.: U.S. consumer price inflation for February YoY Est. 2.5%; core rate YoY Est. 2.5%
- March 11: OPEC monthly report
- Earnings (Estimates based on FactSet data)
- March 11: Exodus Movement (EXOD), pre-market, $0.14
Token Events
For a more comprehensive list of events this week, see CoinDesk’s “Crypto Week Ahead”.
- Governance votes & calls
- Unlock DAO is voting to approve the Unlock Protocol DAO budget for the first and second quarters, totaling $30,768. Voting ends March 11.
- Unlocks
- Token Launches
Conferences
For a more comprehensive list of events this week, see CoinDesk’s “Crypto Week Ahead”.
Market Movements
- BTC is down 0.78% from 4 p.m. ET Tuesday at $69,794.05 (24hrs: -1.92%)
- ETH is down 0.83% at $2,022.17 (24hrs: -1.99%)
- CoinDesk 20 is down 0.98% at 1,979.50 (24hrs: -1.79%)
- Ether CESR Composite Staking Rate is down 3 bps at 2.78%
- BTC funding rate is at -0.0027% (-2.9456% annualized) on Binance
- DXY is up 0.24% at 99.04
- Gold futures are down 0.57% at $5,200.00
- Silver futures are down 2.05% at $87.26
- Nikkei 225 closed up 1.43% at 55,025.37
- Hang Seng closed down 0.24% at 25,898.76
- FTSE 100 is down 0.96% at 10,312.17
- Euro Stoxx 50 is down 1.35% at 5,758.30
- DJIA closed on Tuesday unchanged at 47,706.51
- S&P 500 closed down 0.21% at 6,781.48
- Nasdaq Composite closed unchanged at 22,697.10
- S&P/TSX Composite closed up 0.25% at 33,270.70
- S&P 40 Latin America closed down 0.32% at 3,607.58
- U.S. 10-Year Treasury rate is unchanged at 4.14%
- E-mini S&P 500 futures are down 0.23% at 6,771.75
- E-mini Nasdaq-100 futures are down 0.26% at 24,917.25
- E-mini Dow Jones Industrial Average futures are down 0.37% at 47,569.00
Bitcoin Stats
- BTC Dominance: 59.30% (-(0.08%)
- Ether-bitcoin ratio: 0.0291 (-0.07%)
- Hashrate (seven-day moving average): 1,014 EH/s
- Hashprice (spot): $30.31
- Total fees: 2.7 BTC / $189,651
- CME Futures Open Interest: 105,265 BTC
- BTC priced in gold: 13.4 oz.
- BTC vs gold market cap: 4.64%
Technical Analysis
- The chart shows bitcoin’s daily price swings in candlestick format since July last year. It also shows the average price over 50 days.
- Analysts say this 50-day moving average is a crucial level. A break higher could entice more buyers to the market, leading to a stronger rally.
- The outlook remains bearish while prices hover below the average.
Crypto Equities
- Coinbase Global (COIN): closed on Tuesday at $196.52 (–1.64%), –0.94% at $194.68 in pre-market
- Galaxy Digital (GLXY): closed at $21.83 (+1.56%), –0.41% at $21.74
- MARA Holdings (MARA): closed at $8.57 (–1.04%), –0.58% at $8.52
- Riot Platforms (RIOT): closed at $14.64 (–0.41%), –0.48% at $14.57
- Core Scientific (CORZ): closed at $15.46 (+1.98%)
- CleanSpark (CLSK): closed at $9.63 (+0.21%), –0.42% at $9.59
- Exodus Movement (EXOD): closed at $10.93 (+0.92%), unchanged in pre-market
- CoinShares Bitcoin Mining ETF (WGMI): closed at $37.36 (+0.08%)
- Circle Internet Group (CRCL): closed at $118.09 (+5.59%), –1.38% at $116.46
- Bullish (BLSH): closed at $36.73 (+1.86%), –0.90% at $36.40
Crypto Treasury Companies
- Strategy (MSTR): closed at $138.46 (–0.35%), –0.97% at $137.12
- Strive Asset Management (ASST): closed at $8.98 (+5.52%), –0.78% at $8.91
- Sharplink (SBET): closed at $7.39 (–2.76%), –0.27% at $7.37
- Upexi (UPXI): closed at $0.94 (–2.99%), +2.13% at $0.96
- Lite Strategy (LITS): closed at $1.17 (–2.50%)
ETF Flows
Spot BTC ETFs
- Daily net flows: $246.9 million
- Cumulative net flows: $55.76 billion
- Total BTC holdings ~ 1.28 million
Spot ETH ETFs
- Daily net flows: $12.6 million
- Cumulative net flows: $11.62 billion
- Total ETH holdings ~ 5.68 million
Source: Farside Investors