
Thursday’s session was defined by the intersection of persistent Middle East war tensions, resurging oil prices, and a U.S. labor market picture that remained resilient heading into Friday’s critical nonfarm payrolls report. The U.S. dollar finished the day as the top performer among major currencies, supported by sticky inflation concerns and hawkish Fed commentary, while equities extended their slide and gold sold off sharply despite an ongoing geopolitical backdrop that would normally favor safe-haven assets.
Check out the forex news and economic updates you may have missed in the latest trading session!
Forex News Headlines & Data:
- Australia Household Spending for January 2026: 4.6% y/y (5.2% y/y forecast; 5.0% y/y previous); 0.3% m/m (0.5% m/m forecast; -0.4% m/m previous)
- Australia Balance of Trade for January 2026: 2.63B (4.2B forecast; 3.37B previous)
- Swiss Unemployment Rate for February 2026: 3.2% (3.1% forecast; 3.2% previous)
- Euro area HCOB Construction PMI for February 2026: 46.0 (45.9 forecast; 45.3 previous)
- U.K. S&P Global Construction PMI for February 2026: 44.5 (47.0 forecast; 46.4 previous)
- Euro area Retail Sales for January 2026: 2.0% y/y (1.7% y/y forecast; 1.3% y/y previous); -0.1% m/m (0.5% m/m forecast; -0.5% m/m previous)
- U.S. Challenger Job Cuts for February 2026: 48.31k (95.0k forecast; 108.44k previous)
- U.S. Export Prices for January 2026: 2.6% y/y (2.7% y/y forecast; 3.1% y/y previous); 0.6% m/m (0.4% m/m forecast; 0.3% m/m previous)
- U.S. Import Prices for January 2026: 0.2% m/m (0.2% m/m forecast; 0.1% m/m previous); -0.1% y/y (0.5% y/y forecast; 0.0% y/y previous)
- U.S. Initial Jobless Claims for February 28, 2026: 213.0k (215.0k forecast; 212.0k previous)
- Richmond Fed president Tom Barkin said on Thursday that sticky inflation & improving jobs data could shift the risk outlook for the Fed
- ECB Monetary Policy Meeting Accounts: the Governing Council decided to keep the three key interest rates unchanged, noting that while the euro area economy remains resilient, inflation is expected to stabilize at the 2% target in the medium term.
- On Thursday, Bank of France Governor and European Central Bank policy maker Francois Villeroy de Galhau said that he sees no reason for the ECB to raise interest rates for now
Promotion: Use TradeZella’s AI Powered trade journal to deep-dive into your execution and see exactly how you performed during today’s trading session. Click here to get the TradeZella Edge and use code PIPS20 to save 20% on your subscription!
Disclosure: We may earn a commission from our partners if you sign up through our links, at no extra cost to you.
Broad Market Price Action:
Dollar Index, Gold, S&P 500, Oil, U.S. 10-yr Yield, Bitcoin Overlay – Chart Faster With TradingView
Thursday’s session saw a divergence in asset class behavior that underscored the conflicting forces at play in markets dominated by the ongoing U.S.-Israeli war on Iran, now in its sixth day with no sign of de-escalation. Oil surged to fresh war-era highs, bond yields continued their fourth consecutive day of rises, equities extended losses, and gold fell sharply despite the backdrop of active military conflict. The broad market overlay told a clear story: WTI crude was the dominant mover, while risk assets continued to retreat.
WTI crude oil was Thursday’s standout performer, rallying approximately 4.31% to trade near $78.50 per barrel by the chart’s final print, with intraday highs reaching the $80.56 area. The move reflected ongoing supply disruption concerns as the U.S.-Israeli conflict continued to affect crude flows through the Strait of Hormuz. China’s reported efforts to conserve fuel amid the disruptions added to supply-demand anxiety. The rally accelerated through the U.S. session, breaking above key resistance near $77.00 before reaching its high around the $80.50 zone ahead of what appeared to be some modest late-session profit-taking.
The S&P 500 declined approximately 0.83% to close near 6,822, as seen on the individual chart, though the index bounced off intraday lows near the 6,772 support level before partially recovering into the close. The broader selloff was driven in part by news that the U.S. is considering requiring export permits for AI semiconductor sales, which weighed on chipmakers including Nvidia and Advanced Micro Devices. The index had briefly attempted a recovery during the early London session around the 04:30 ET area, reaching near 6,886, but those gains evaporated entirely once U.S. trading got underway.
Gold declined 1.66% to settle near $5,079.50 per ounce, a notable reversal from the safe-haven buying that had pushed the metal to fresh highs earlier in the week. The chart shows gold traded relatively steady through the Asian session around the $5,165 area before rolling over sharply around the time of the Challenger job cuts release. The metal spent the remainder of the session in a broad, grinding downtrend, ultimately finding some tentative support near the $5,051 zone. The selloff was somewhat counterintuitive given the active geopolitical conflict, but likely reflected a combination of profit-taking after a strong multi-day run, rising yields making non-yielding assets less attractive, and a broadly stronger U.S. dollar weighing on dollar-denominated commodities.
Bitcoin extended its recent decline, falling approximately 2.82% to settle near $71,280. The chart shows BTC underperforming through early Asian trading and into the London open, spiking near the $73,608 zone around the 04:30 ET mark, before reversing sharply. From there, the cryptocurrency entered a sustained downtrend through the U.S. session, breaching support near $72,041 and $71,760, before finding a floor around $70,655 ahead of a modest bounce. The selloff appeared to track broader risk-off sentiment in speculative assets.
The U.S. 10-year Treasury yield climbed approximately 3 basis points to 4.133%, marking the fourth consecutive day of rising yields, according to chart data. The 10-year opened Thursday’s Asian session near 4.10% and spent the night grinding higher in a measured fashion, reaching a peak near the 4.153% level during the U.S. session before pulling back modestly into the close. The persistent rise in yields reflected ongoing concern that elevated oil prices could entrench inflationary pressures and limit the Federal Reserve’s ability to cut rates. Q4 2025 unit labor costs came in at 2.8% quarter-over-quarter against a -0.7% forecast, a sharp upside surprise that reinforced concerns about cost-push inflation. Richmond Fed President Barkin explicitly flagged the risk that sticky inflation combined with solid labor market data could shift the Fed’s policy risk balance, a comment that may have contributed to the yield bid through the session.
Promoted: Day traders & Scalpers have better odds of making great decisions if they see & hear market catalysts right away. Get the real-time feed that pros use to catch the news.
Join FinancialJuice for Free to learn more!
Disclosure: We may earn a commission from our partners if you sign up through our links, at no extra cost to you.
FX Market Behavior: U.S. Dollar vs. Majors
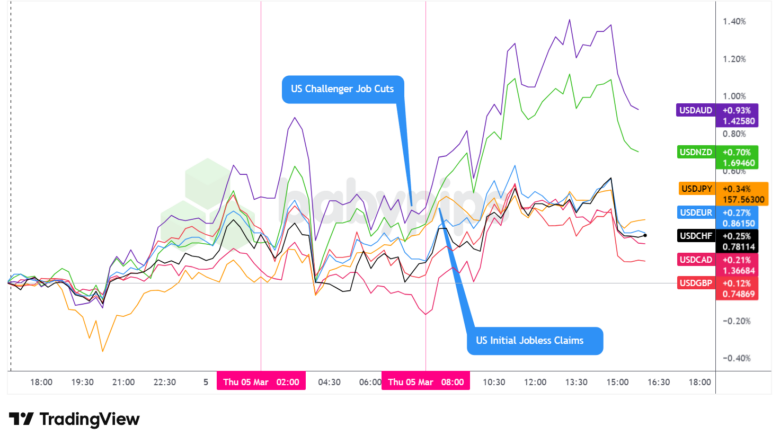
Overlay of USD vs. Majors – Chart Faster With TradingView
The U.S. dollar was Thursday’s top-performing major currency, supported by a combination of resilient U.S. labor market data, upside inflation surprises in wage cost metrics, and hawkish commentary from Fed officials, all set against a backdrop of elevated oil prices that continued to suppress rate cut expectations.
During the Asian session, the dollar traded net positive against the major currencies. With few regional catalysts of note, the greenback’s bid likely reflected a continuation of the risk-off tone from the prior session, with oil remaining at elevated levels and geopolitical uncertainty keeping safe-haven demand for the dollar intact. The overlay chart shows a gradual, broad-based drift higher in USD pairs through early Asian hours, with AUD and NZD as the weakest majors against the dollar during this period.
During the London session, the dollar traded mostly sideways and choppy against the major currencies, arguably with a net bearish lean. Construction PMI data from both the UK and the eurozone came in below forecast, with the UK reading at 44.5 versus 47.0 expected. Euro area retail sales also disappointed on a month-over-month basis, contracting 0.1% against a 0.5% gain expected. Despite the soft European data, the dollar failed to extend meaningful gains through the London session, possibly as traders positioned ahead of the U.S. data calendar. The chart also shows a clear spike lower in all USD pairs around the 04:30 ET area, consistent with the Challenger job cuts release, which printed a strikingly low 48.31k versus the 95.0k forecast. The sharp drop in layoffs was likely initially interpreted as dollar-positive, creating a brief risk-off impulse that held going into the next session.
During the U.S. session, the dollar traded net higher against the major currencies until the London session close. A combination of factors likely supported the greenback through the U.S. morning and early afternoon: Q4 2025 unit labor costs surprised sharply to the upside at 2.8% quarter-over-quarter, while nonfarm productivity came in well below expectations at 2.8% versus 4.0% forecast, a combination that suggested labor cost pressures remain sticky. Initial jobless claims printed at 213k, essentially flat with the prior reading and below the 215k forecast, reinforcing the picture of a still-tight labor market.
Richmond Fed President Barkin added to the hawkish tilt, warning that improving jobs data and persistent inflation could shift the risk outlook for the Fed. After the London close, the dollar chopped mostly sideways against the major currencies before dipping modestly ahead of the U.S. session close.
Promoted: While new firms come and go with the volatility, The5ers has spent the last 10 years perfecting a funding model that works for the trader. It’s why over 1.6 million traders worldwide trust them to provide the capital and scaling needed to turn market analysis into meaningful professional growth.
Learn more about The5ers Disclosure: We may earn a commission from our partners if you sign up through our links, at no extra cost to you.
Upcoming Potential Catalysts on the Economic Calendar
- Germany Factory Orders for January 2026 at 7:00 am GMT
- U.K. Halifax House Price Index for February 2026 at 7:00 am GMT
- Euro area GDP Growth Rate 3rd Est for December 31, 2025 at 10:00 am GMT
- Euro area Employment Change Final for December 31, 2025 at 10:00 am GMT
- European Central Bank President Lagarde Speech at 10:00 am GMT
- U.K. BBA Mortgage Rate for February 2026 at 10:00 am GMT
- U.S. Nonfarm Payrolls for February 2026 at 1:30 pm GMT
- U.S. Average Hourly Earnings for February 2026 at 1:30 pm GMT
- U.S. Unemployment Rate for February 2026 at 1:30 pm GMT
- U.S. Retail Sales for January 2026 at 1:30 pm GMT
- Canada Ivey PMI s.a for February 2026 at 3:00 pm GMT
- U.S. Business Inventories for December 2025 at 3:00 pm GMT
- Euro area ECB Schnabel Speech at 5:00 pm GMT
- Australia RBA Hauser Speech at 6:30 pm GMT
- U.S. Fed Hammack Speech at 6:30 pm GMT
- U.S. Consumer Credit Change for January 2026 at 8:00 pm GMT
Friday’s session is headlined by the February U.S. nonfarm payrolls report at 1:30 pm GMT, accompanied by average hourly earnings and the unemployment rate. This data will be the most consequential release of the week, arriving at a moment when markets are acutely focused on whether the labor market can remain resilient in the face of oil-driven inflation pressures. Richmond Fed President Barkin’s Thursday comments about the interplay between jobs data and inflation expectations suggest Fed officials are closely monitoring the print. A stronger-than-expected report could reinforce the higher-for-longer yield narrative, while a soft reading would likely revive rate cut expectations but also raise stagflation concerns given elevated energy prices.
Also at 1:30 pm GMT, U.S. retail sales for January 2026 will provide an additional read on consumer demand.
Earlier in the session, Germany factory orders for January 2026 (7:00 am GMT) and the third estimate of euro area GDP for Q4 2025 (10:00 am GMT) will be in focus alongside the euro area employment change final for the same period.
ECB President Lagarde is scheduled to speak at 10:00 am GMT, and traders will be watching closely for any shift in tone following the ECB’s Thursday meeting accounts which reiterated a data-dependent stance amid geopolitical and energy price risks. ECB’s Schnabel is also on the calendar at 5:00 pm GMT.
From the UK, the Halifax House Price Index for February 2026 prints at 7:00 am GMT, and BBA mortgage rate data for February 2026 follows at 10:00 am GMT.
Canada’s Ivey PMI for February 2026 is due at 3:00 pm GMT, to give us signals on the health of Canada’s business sector and potentially signals of health for the overall economy.
Stay frosty out there, forex friends!
Promoted: How Do Professionals Trade Geopolitical Shocks?
You’ve seen the retail reaction to the military strikes in the Middle East—now see the institutional one. Brent Donnelly’s “The Art of Currency Trading” (4.7 stars & 517 reviews on Amazon) bridges the gap between the news headlines you read and the execution on your screen. It’s a practical, “no-fluff” guide to how professional FX desks navigate the exact type of geopolitical volatility described in today’s report.
Learn more about “The Art of Currency Trading” at Amazon
Disclosure: We may earn a commission from our partners if you sign up through our links, at no extra cost to you.