2026-03-05 02:42:00
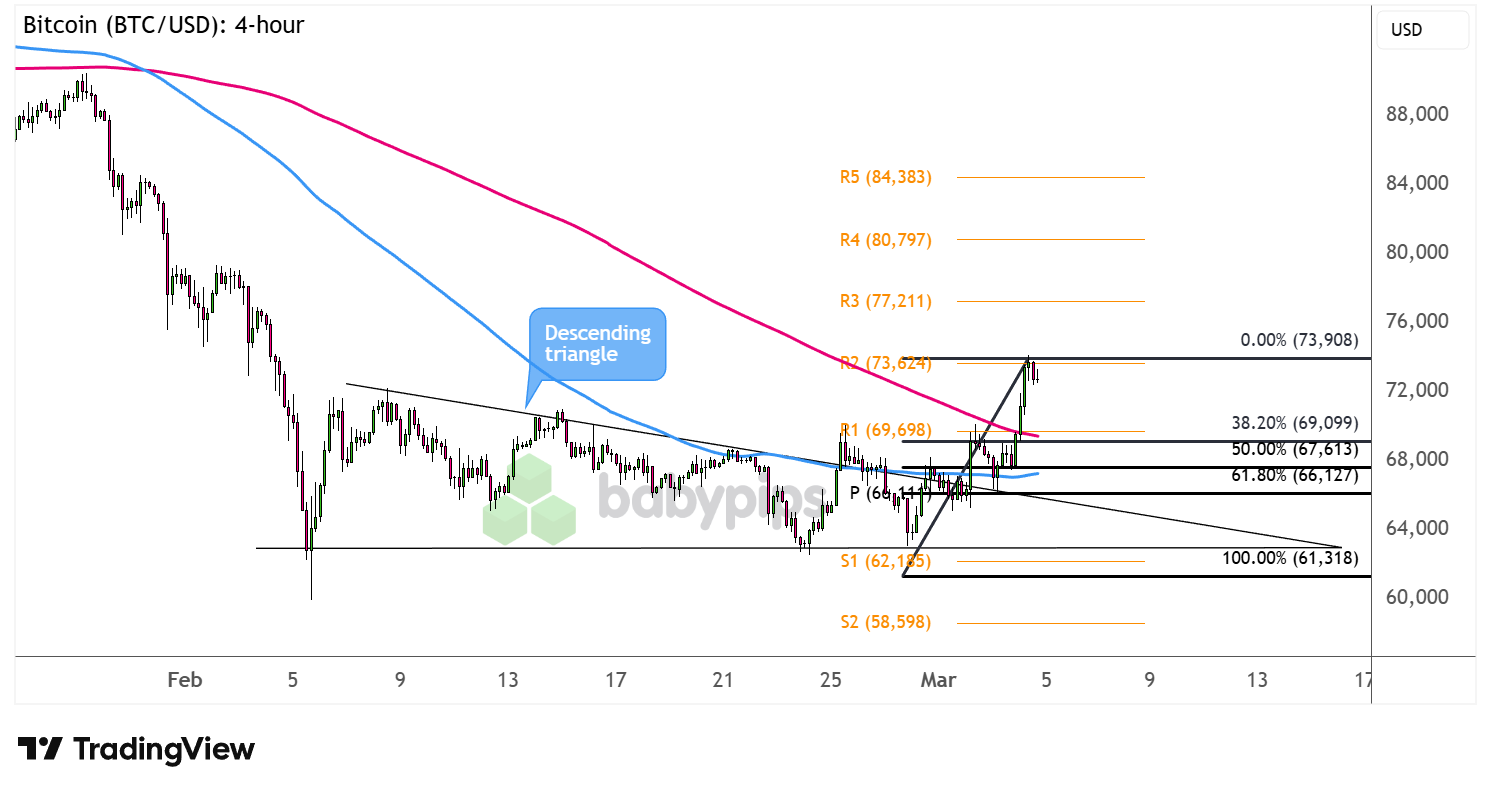
Remember that descending triangle we were watching on bitcoin a few days back?
The OG crypto just made a bullish breakout and may be gathering more upside momentum.
Take a look at these potential pullback levels on the 4-hour chart.
Risk-off flows spurred by heightened US-Iran geopolitical tensions over the weekend appeared to renew the safe-haven appeal of bitcoin, though the modest rebound in equities from defense sector rallies could also be providing tailwinds.
BTC/USD has since busted through the top of its triangle consolidation pattern to hint that further gains are possible.
Could this be the start of a longer-term recovery?
Remember that directional biases and volatility conditions in market price are typically driven by fundamentals. If you haven’t yet done your homework on bitcoin and the U.S. dollar, then it’s time to check out the economic calendar and stay updated on daily fundamental news!
Bitcoin appears to be hitting a roadblock at R2 ($73,624) and might be due for a quick pullback to encourage more buyers to hop in.
The Fibonacci retracement tool shows that the 38.2% level lines up with R1 ($69,698) while the 50% Fib is near the 100 SMA dynamic support, which is above the 200 SMA to suggest that the path of least resistance is to the upside.
Look out for a larger pullback that could reach the 61.8% level around the broken triangle resistance which could now hold as support. Reversal candlesticks at this region could point to a bounce, possibly taking bitcoin back up to the swing high near the $74,000 handle or to fresh upside targets at R3 ($77,211) or R4 ($80,797).
On the other hand, long red candles closing below the triangle bottom and S1 ($62,185) could suggest that bearish pressure is still very much in play.
Whichever bias you end up trading, don’t forget to practice proper risk management and stay aware of top-tier catalysts that could influence overall market sentiment.
Promoted: The Analysis & Strategy are only half the Battle; Your Mindset is the Rest.
Today’s Chart Art zooms in on bitcoin’s breakout. But as any pro will tell you, even the cleanest trend-following setup can fall apart if the trader doesn’t stay disciplined when price starts testing the target levels.
In “Unknown Market Wizards,” Jack Schwager interviews successful traders to reveal a common truth: their edge isn’t just knowledge or skills—it’s their psychological resilience and rigid risk control. Whether you’re navigating tariff shocks or safe haven flows into the franc, learn how the “wizards” stay clinical when the rest of the market is emotional.
Master Your Trading Mindset with the Unknown Market Wizards book on Amazon!
Disclosure: We may earn a commission from our partners if you sign up through our links, at no extra cost to you.
Please be aware that the technical analysis content provided herein is for informational and educational purposes only. It should not be construed as trading advice or a suggestion of any specific directional bias. Technical analysis is just one aspect of a comprehensive trading strategy. The technical setups discussed are intended to highlight potential areas of interest that other traders may be observing. Ultimately, all trading decisions, risk management strategies, and their resulting outcomes are the sole responsibility of each individual trader. Please trade responsibly.
This content is strictly for informational purposes only and does not constitute as investment advice. Trading any financial market involves risk. Please read our Risk Disclosure to make sure you understand the risks involved.

