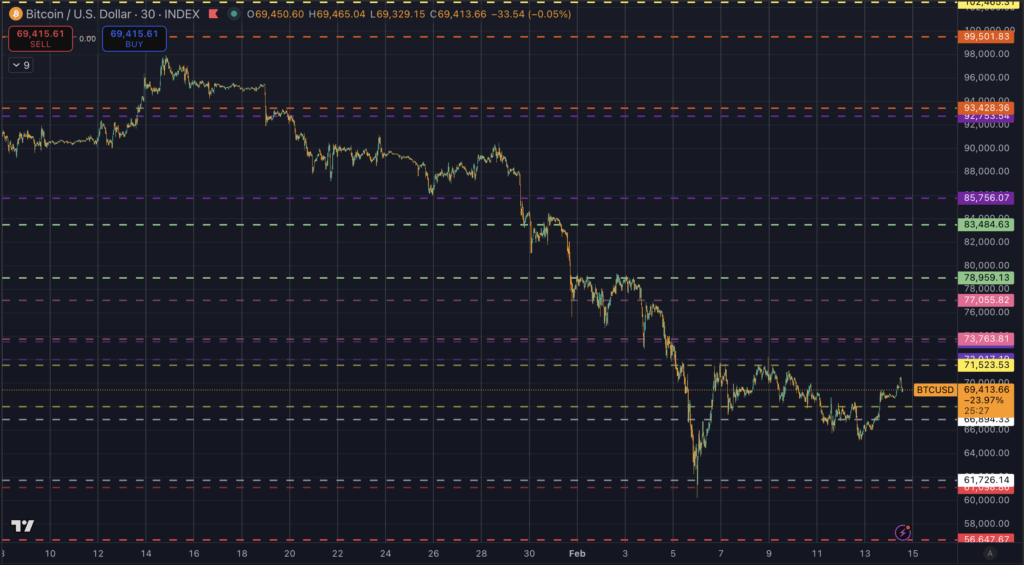


Bitcoin is holding its ground this weekend. After Friday’s soft CPI rally, price keeps leaning into the same overhead zone around $70,300, and bids keep showing up above $65,000.
That detail matters more than the stall.
Last Sunday I framed $71,500 as the market’s checkpoint, the line that decides whether this bounce becomes a recovery or fades into another leg down. The logic stays the same, the level stays the same, and the market’s behavior underneath it looks different this time.
Bitcoin already lived through the violent part of this story. The crash down toward $60,000 left a long wick and a long memory. Since then, price has clawed back into the low $70,000s, and every push higher has forced the same question, is this rally rebuilding structure, or is it simply giving traders a cleaner place to sell?
The soft CPI print gave Bitcoin the kind of fuel it usually needs to test resistance with conviction. Price rallied, the chart brightened, and the market drifted into that familiar decision zone again.
Now it’s Saturday morning, liquidity is thinner, and the candles look like they’re hesitating around $70,300. On paper, this is where weak bounces often unwind, especially after a macro headline move. In practice, Bitcoin keeps refusing to give sellers the easy follow through.
That refusal is the setup.
A market that wants lower prices tends to show it quickly on a weekend. It slips through shelves, it hunts stops, it revisits the wick, and it turns every bounce into an exit ramp. This weekend has a different feel, the pullbacks keep getting caught, and the floor around $65,000 keeps holding even as price struggles to clear the next ceiling.
That kind of behavior fits a familiar phase in a damaged market, the part where price stops falling fast, starts moving sideways, and forces both sides to wait.
It also fits the human side of this cycle. Traders remember $60,000 as the panic candle. Long term holders remember the speed of the drop and the silence that followed. Newer investors remember how quickly confidence turned into liquidation.
When price holds above $65,000 after a CPI-driven pop, it gives the crowd something they rarely get after a shock, time.
The weekend floor is the real story, and $65,000 has turned into a barometer
Weekend price action strips markets down to their basics. The order book gets thinner, the headlines slow down, and the only thing that matters is whether buyers actually show up when the chart looks heavy.
Right now, they are showing up.
Bitcoin keeps pressing into the $70,000 area, it keeps bumping into $70,300, and it keeps backing off in slow motion. The important part sits underneath, each dip keeps finding support before it turns into a slide. That support is clustering around $65,000, and it is starting to feel like a line the market respects.
That matters because the last major reference point beneath it is the wick low near $60,000. That zone carries the kind of emotional weight that turns small pullbacks into big reactions. When price hovers in the high $60,000s and low $70,000s, the market starts asking whether another wick revisit is coming.
When price holds through a weekend, the market starts asking a different question, whether the wick already did its job.
A local bottom rarely arrives with a clean announcement. It usually arrives as a change in rhythm.
The rhythm shift looks like this, sellers push, buyers absorb, and price stops traveling as far on each wave. The chart starts building a range instead of building fear. The market starts trading time instead of trading distance.
That is why a stall at $70,300 can still read bullish in context.
A stall becomes valuable when it comes with resilience underneath. It turns resistance into a pressure test. It also turns support into a living level that everyone watches in real time.
It is also worth remembering how $71,500 fits into this.
Last week, Bitcoin kept knocking on that door, and each attempt ran out of oxygen. This week, the market is hesitating earlier, which often shows up when sellers try to defend sooner, and buyers keep stepping in anyway. That dynamic can lead to a breakout later, and it can also lead to more sideways frustration first, especially when traders keep trying to front-run the move.
Sideways action has a strange reputation in Bitcoin, because people associate it with boredom. In reality, sideways often marks the most important negotiation in the whole move. It’s where leverage resets, where late sellers finally exit, where patient buyers accumulate, and where the market decides whether the next push has support behind it.
If Bitcoin keeps holding $65,000 while continuing to probe $70,300, the chart starts to look less like a failed bounce and more like a base forming under resistance. That base does not erase the larger cycle debate, but it does change the near-term path.
$71,500 remains the checkpoint, and $60,000 remains the scar tissue
The market still has a clear hierarchy of levels.
$71,500 remains the major checkpoint, because it has already rejected price multiple times since the crash. It is the line where traders decide whether the recovery has real acceptance above it, or whether the move stays trapped in the same band.
$70,300 matters today because it is where the market is stalling right now. It is also close enough to $71,500 to act like a pretest, a place where sellers try to lean early, and where buyers get a preview of how crowded the ceiling is.
$65,000 matters because it is the line Bitcoin keeps defending during thin weekend liquidity. It is the nearest shelf that keeps the chart from sliding into the emotional gravity of the wick.
Then $60,000 sits below everything as the scar tissue level. That wick low created a shared memory, and shared memories create reflexes. Traders tighten stops, holders feel tension, and the market becomes jumpier the closer price gets to that zone.
Bitcoin’s sideways action reduces the immediate pressure from that memory. It also gives the market space to do something healthier, to trade sideways and rebuild structure.
This is where the broader cycle story still matters, because a local base can form inside a bigger bearish framework. The market can carve out a range, squeeze shorts, reclaim a level, and still face deeper stress later in the year when liquidity shifts, when risk appetite fades, or when macro conditions tighten again.
My $49,000 bear target still sits in that bigger picture. It remains a plausible destination later this year if the cycle continues to unwind and if risk drains out of the system again. That target belongs to the macro path, the kind of move that comes with fear returning, volatility expanding, and market plumbing showing stress.
The current price behavior belongs to a nearer chapter. This chapter looks like resilience, a rally sparked by soft CPI data, a stall under resistance, and a steady defense of $65,000 even when the weekend gives sellers a chance to press.
Both chapters can be true at the same time.
That is why this moment is useful. It gives the market a chance to show whether the bounce has a floor, and it gives traders a map that doesn’t rely on predictions.
If Bitcoin reclaims $71,500 and holds above it, the next resistance zones on my map come back into focus, around $73,700, then $77,000, then just under $79,000. Those levels matter because they are where the market has paused, reversed, or accelerated before, and they are where profit taking and leverage triggers tend to cluster.
If Bitcoin keeps stalling under $70,300 and slips back into the mid range, the shelves below stay relevant, especially $66,900 and $65,000. A strong defense of those levels keeps the sideways thesis alive, and a clean break beneath them shifts attention back toward the $60,000 memory zone.
Levels to watch, and what “bullish” looks like from here
This setup is simpler than it looks.
A bullish read in the near term looks like continued range building, price holding above key levels, and repeated pressure on $70,300 that eventually leads to another attempt at $71,500. It looks like dips that get bought quickly, and it looks like sellers struggling to push the market into a deeper unwind.
It also looks like patience.
A range can last longer than people expect, especially after a violent move. It can chop up both longs and shorts, and it can frustrate anyone who needs a clean narrative. That frustration often becomes fuel later, because it shakes out leverage and rebuilds a healthier base.
Here is the clean map for the week ahead.
- $71,500, the major reclaim line, acceptance above it changes the tone and opens the higher bands.
- $70,300, today’s stall point, a sustained push above it increases the odds of a fresh $71,500 test.
- $70,000, the psychological hinge, a level that often decides whether dips stay controlled.
- $66,900, the mid band shelf, where momentum often resets and where weak moves often fade.
- $65,000, the weekend barometer, a level that keeps the local bottom thesis intact while it holds.
- ~$60,000, the wick low memory zone, a revisit would likely bring speed and emotion back into the chart.
- $49,000, the larger cycle bear target, a later-year destination if macro stress returns and risk unwinds further.
What I’m watching when the market moves is also simple.
Speed, does Bitcoin slice through resistance or grind into it. Follow through, does price hold above reclaimed levels long enough for acceptance to form. Reaction, does the market defend support aggressively, or does it give it up in slow motion.
Saturday’s data point so far is clear. Bitcoin is stalling around $70,300, and it is holding above local lows through thin liquidity. That combination leans bullish for a local bottom and a sideways phase, because it suggests demand is active underneath, and sellers are running into absorption.
The bigger cycle still has room for another painful chapter later this year. The near term chart is printing a quieter signal, resilience after a shock.
Disclosure, this is market commentary, financial decisions require personal responsibility and appropriate professional guidance.