NASDAQ Futures Technical Analysis Today: Key Price Levels That Will Decide Direction
2026-02-10 09:10:00
NASDAQ 100 futures (NQ) are currently rotating near the 25,330–25,350 area, a zone that has acted as the market’s balance point so far today. While price has moved both higher and lower intraday, neither buyers nor sellers have been able to force lasting acceptance outside this range.
This makes 25,365 on the upside and 25,310 on the downside the two most important price areas to watch for the rest of today’s session.
These levels are not arbitrary. They reflect where the market has repeatedly tested, rejected, and re-tested value. That is why professional traders, algorithms, and institutions are focused on them. But before we do that, let’s jump into the broader technical analysis view for today’s Nasdaq:
Today’s Nasdaq Market Context: Balance Before Direction
Market dynamics for February 10, 2026, are being shaped by a landmark US-India trade deal targeting $500 billion in purchases, which promises to slash tariffs on American energy, technology, and agricultural exports. This geopolitical shift coincides with a significant move in Asian markets, where China’s onshore yuan (CNY) has surged to its highest level since May 2023 as Beijing reportedly encourages banks to reduce U.S. Treasury exposure. While the day’s economic calendar features December U.S. Retail Sales and the Employment Cost Index, these are largely viewed as lagging indicators as traders brace for tomorrow’s Non-Farm Payrolls report.
In the commodities and digital asset space, precious metals like gold and silver have managed a tentative bounce since Friday, though they currently lack the “spark” to overcome key resistance levels near $5,100 and $89.25, respectively. Meanwhile, Bitcoin technical analysis shows the cryptocurrency holding above critical VWAP support zones following a 21% surge. Traders are closely monitoring the $67,750 level to determine if this rebound marks the start of a genuine base-building phase or a temporary counter-trend move before further volatility.
So let’s see how all of the above contributed to today’s Nasdaq futures so far. At the time of analysis, NASDAQ futures remain in a balanced market environment:
-
Price is rotating around VWAP
-
Value areas from recent sessions overlap heavily
-
Moves beyond the range have struggled to hold
In practical terms, this tells us the market is still negotiating value, not trending. In this type of environment, price movement alone is not enough. What matters is whether the market accepts higher or lower prices after testing them.
The tradeCompass Levels That Matter Today
tradeCompass key zones for NQ today
Bullish Acceptance Zone for Nasdaq Futures Today
Above 25,365
A more constructive bullish outlook only develops if:
If the market accepts above this zone, it signals that participants are comfortable doing business at higher prices. That is when upside targets later in the session become more realistic.
Without acceptance, upside moves are more likely to be fades back toward VWAP.
Bearish Acceptance Zone for Nasdaq Futures Today
Below 25,310
A bearish scenario gains traction only if:
If price dips below this area but quickly returns, it suggests sellers are not in control and downside risk is limited.
Neutral and Rotational Zone for Nasdaq Futures Today
Between 25,310 and 25,365
As long as price remains inside this range:
This is the zone where many traders get chopped up by reacting to every small move. Professionals typically wait for confirmation outside of it.
Delta Insight Without the Noise
Delta, which reflects the balance between aggressive buying and selling, adds important context to today’s price action.
So far:
-
Buying pressure has appeared, but has not steadily expanded
-
Selling pressure has also appeared, but without follow-through
-
Neither side has been able to impose control
This mixed delta behavior supports the broader message from price action. The market is active, but not yet decisive.
When delta begins to progress consistently in one direction after price leaves the value area, that is when conviction usually follows.
Why These Nasdaq Futures Levels Are Different From Random Numbers
Anyone can say:
“If NASDAQ goes above 25,500 it is bullish. If it goes below, it is bearish.”
That statement sounds confident, but it lacks context.
The levels discussed here are different because they are based on:
-
Where value was established
-
Where acceptance previously failed
-
Where professional participants are most likely to react
This is why the tradeCompass framework focuses on behavior around key zones, not single price prints.
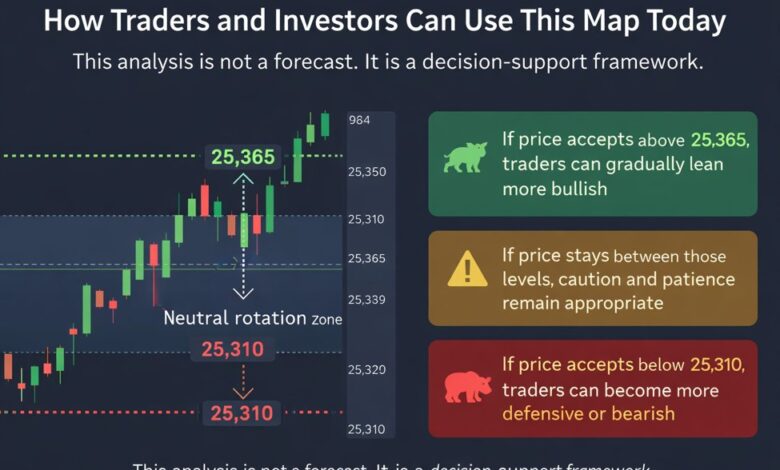
How Nasdaq Traders and Investors Can Use This Map Today
This analysis is not a forecast. It is a decision-support framework.
-
If price accepts above 25,365, traders can gradually lean more bullish
-
If price accepts below 25,310, traders can become more defensive or bearish
-
If price stays between those levels, caution and patience remain appropriate
Used alongside your own tools, timeframes, and risk management, this approach helps reduce emotional decisions and improves alignment with how professional markets actually function.
NASDAQ futures are at an inflection point today.
The next meaningful move is likely to come after value acceptance, not during the current back-and-forth. Watching how price behaves around 25,365 and 25,310 will provide far more insight than reacting to every tick in between.
This tradeCompass-style analysis offers a professional map of the market, not a promise of direction.
Trade at your own risk.