Either Bitcoin reclaims this crucial zone immediately or the mid-range drift back toward $61,000 begins


Bitcoin keeps knocking on $71,500, sooner or later the door opens
Bitcoin made a familiar but stressful move this week; it bounced hard enough to make the skeptics quiet and the dip buyers loud again.
After the crash down to around $60,000, the price clawed its way back to the a spot that has become the center of gravity, the $71,500 zone.
It has already been there three times.
Each time, the market hesitated, traders leaned in, and the rally ran out of oxygen. Now Bitcoin is back around $70,900, it looks like it wants to test $71,500 again, and this is the moment worth paying attention to, even if you don’t trade, even if you only check the price once a week.
Because some levels are more like shared memories than simple numbers on a screen.
$71,500 is one of those.
Why $71,500 keeps showing up
When a level gets tested again and again, it becomes a kind of public square.
Everyone sees it on their chart. But not everyone discusses it in group chats or has a plan for it.
That matters because Bitcoin is a market that runs on emotion as much as math.
When price approaches a level like $71,500 after a violent drop, you get a mix of people who want out, people who want in, and people who want confirmation. That creates friction, and friction creates the stalling you can see on the chart.
For traders, this is where decisions get made quickly, stops get placed tightly, and leverage gets bold.
For long-term holders, this is where the story gets rewritten. A market that couldn’t get above $71,500 starts to feel weak, a market that reclaims it starts to feel repaired.
That difference in feeling is why the zone matters.
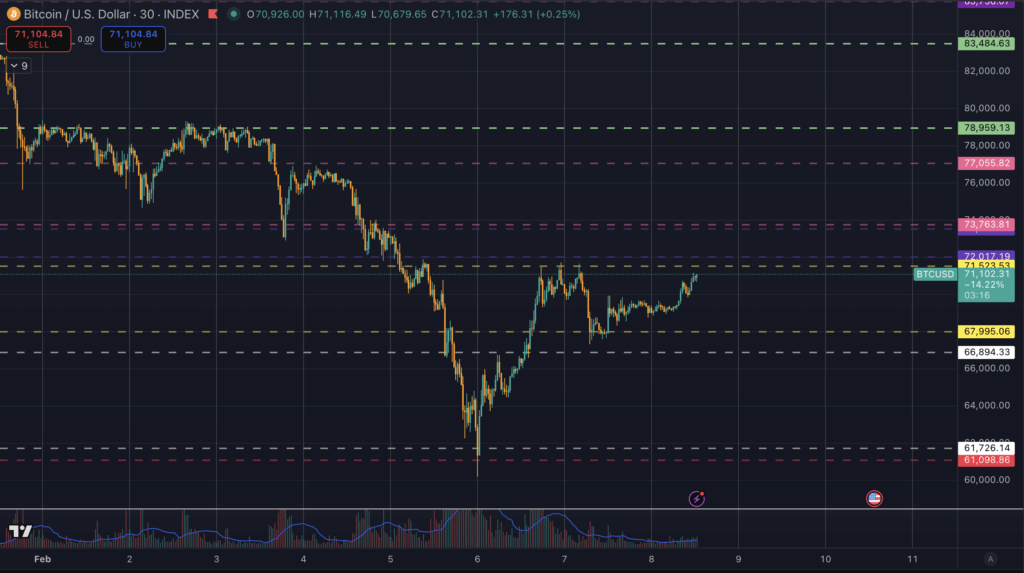
The lines on my chart are not decoration
The horizontal lines in the chart are the top and bottom of channels I’ve tracked over the last two years.
They are areas where Bitcoin has repeatedly found support or slammed into resistance. They are built from a blend of historical leverage behavior, order-book dynamics, psychological price levels, and the familiar entry and exit points many traders use when trading with size.
I’m not pretending this is a magic formula, it’s a map. It gives me a way to stop guessing and start planning.
And right now, that map says $71,500 is the next major checkpoint.
If you’ve been following my work this cycle, you’ll recognize the theme. I’ve spent months writing about how cycle highs form, how risk leaks out of the system, and how bear markets often feel obvious in hindsight but rarely feel obvious in the moment.
Back in the fall, I argued that the market was showing signs the cycle had already topped, even while the mood was still euphoric. That case is laid out in ‘Time is up: The case for why Bitcoin bear market cycle started at $126k.’
I also talked about the time window that tends to surround a cycle peak, and whether ETFs could bend that history, in ‘Bitcoin’s cycle clock points to a final high by late October, will ETFs rewrite history?.’
Then I made the call that upset a lot of people, the idea that Bitcoin could still fall toward $49,000 during this phase of the downturn. That thesis lives in ‘Akiba’s medium term $49k Bitcoin bear thesis – why this winter will be the shortest yet,’ and I followed up in January when I started seeing the kind of structural stress that makes selloffs accelerate, in ‘I predicted Bitcoin falling to $49k this year and January delivered some very concerning red flags.’
.
Most recently, after the drawdown deepened, I wrote that my $49k view was still on track, while also pointing out that Bitcoin was approaching a zone where I expected real demand to start showing up again, in ‘My $49k Bitcoin prediction playing out but BTC is closing in on a major BUY ZONE.’
This new piece is the next chapter of that same story, the market is trying to decide whether it’s healing or simply catching its breath.
$71,500 is where that decision becomes visible.
What a fourth test usually means
Three failed attempts at the same level can mean two different things, and the difference is all about how price behaves on the next approach.
Sometimes repeated tests weaken resistance, sellers get absorbed, the wall gets thinner each time, and eventually price pushes through.
Other times repeated tests create a trap, buyers get impatient, leverage piles up, stops stack underneath, and a rejection becomes the spark for a sharper move down.
You can feel that tension in the way the chart looks right now, the rally has been steady, it has lacked the explosive urgency that usually shows up when the market is fully confident.
That can change quickly, and that’s why this is a useful moment to talk about levels instead of predictions.
Here’s how I’m framing $71,500
I’m treating $71,500 as a line where the market has to prove itself.
A clean move above it means something only if it holds. In Bitcoin, wicks are common, breakouts that fail are common, and the difference between strength and noise is whether price can stay above a reclaimed level long enough for traders to stop treating it as a short.
If Bitcoin breaks above $71,500 and builds acceptance above it, the upside targets become the next bands on my map.
On my chart, the next zones above are around $73,700, then $77,000, then just under $79,000.
Those levels matter because they are where the market has historically paused, reversed, or accelerated. They are the next places where profit-taking tends to concentrate and where leveraged traders tend to set their next triggers.
If Bitcoin fails at $71,500 again, the tone changes.
It tells you that the bounce from $60,000 has not yet repaired the structure, it tells you sellers are still defending the same ceiling, and it raises the odds that price drifts back into the mid-range areas where it has already spent time during this recovery.
On my chart, the nearer shelves below are around $70,000 and $66,900, and deeper support memory sits down closer to the low $61,000s.
This is why $71,500 matters, it sits right at the edge of the recovery channel, and it’s the simplest way to separate continuation from rejection without forcing a narrative onto the chart.
The human part traders forget
Every time Bitcoin approaches a level like $71,500, there’s a crowd of people behind the candles.
There’s the retail trader who bought late in the cycle, watched the drawdown, promised themselves they’d sell the next time they got close to break even.
There’s the long-term holder who has seen this movie before, who doesn’t panic, but still feels the tension in their stomach when price returns to a spot that has already failed multiple times.
There’s the new investor who only learned what a “liquidity sweep” is last month, who is trying to figure out whether this bounce means safety has returned.
There’s the desk trader who doesn’t care about narratives, who only cares where stops are likely to be clustered, and how much liquidity is sitting in the book around a known level.
All of those people behave differently, and all of them interact at the same price.
That’s why charts work, they’re just a record of human behavior.
And that’s why I keep coming back to these channel bands. They give me a way to anchor human emotion to repeatable areas of interest.
How this fits the bigger cycle story
I don’t view $71,500 as a permanent ceiling. I view it as the next checkpoint inside a broader cycle that has already gone through the euphoric top phase and into the damage control phase.
That was the heart of my argument in my bear market call, and it’s why I was comfortable putting a controversial number like $49,000 on paper in my thesis.
The crash to $60,000 does not invalidate that bigger idea. It confirms something more important, the market is capable of fast, violent repricings again.
In January, I wrote about the kinds of red flags that show up when the system is stressed, from the way flows shift to the way miners and market plumbing behave.
Those things don’t resolve overnight.
What does happen, though, is that markets breathe, they sell off, they bounce, they lure people back in, and then they reveal whether the bounce had real strength behind it.
That is the moment we are approaching now.
The $71,500 zone is where the bounce gets tested in public.
Levels to watch, simple version
If you want the cleanest way to follow this without getting lost in indicators, here’s how I’d simplify it.
- $71,500, the line the market keeps rejecting, a reclaim that holds changes the tone.
- $73,700, the next resistance band above, the first place I expect sellers to test a breakout.
- $77,000 to $79,000, the higher bands, where a stronger continuation would likely run into heavier friction.
- $70,000, the nearest shelf below, if the market loses this after another rejection it signals weakness.
- $66,900, the deeper mid band, a level that often becomes relevant when momentum fades.
- Low $61,000s, the post-crash memory zone, where the market showed its hand during the capitulation move.
That’s the map.
The rest is watching how Bitcoin behaves when it touches the line, and resisting the urge to invent certainty.
What I’m watching when we get there
When price hits $71,500 again, I’m watching for three simple things.
- First, speed. Does Bitcoin slice through quickly, or does it grind and hesitate?
- Second, follow through. A breakout that can’t hold often leads to sharper moves, because it creates trapped positions.
- Third, reaction. The market tells you what it thinks about a level by how aggressively it defends or reclaims it.
If Bitcoin clears $71,500 and holds, the story shifts toward recovery and continuation. If it rejects again, the story shifts back toward a market that is still working through damage.
And either way, that matters more than a thousand hot takes.
Because in a cycle like this, the most valuable thing you can have is a plan, and the most expensive thing you can have is confidence with no map.
Closing thought
Bitcoin does not announce what it’s about to do. It leaves clues, and those clues tend to gather around the same zones, again and again.
Right now, $71,500 is the clearest clue on the board.
It has already been tested three times since the $60,000 crash. Price is approaching again. Traders will treat it like a battlefield. Long term holders will treat it like a barometer.
And the market will treat it like what it is, a level that decides whether this bounce becomes something bigger, or whether Bitcoin still has more winter left to show us.
Disclosure, this is market commentary, not financial advice. Risk management matters more than narratives.