We’re at a price level Bitcoin has always defended and the current $67,000 BTC mining cost matters

Trader Plan C recently surfaced a chart indicating a production-cost model placing Bitcoin’s marginal mining expense at approximately $67,000, with historical price action showing repeated bounces off that red line.
He added that “commodities rarely trade below their cost of production.” The hook is clean, the logic is intuitive, but the reality beneath Bitcoin’s latest volatility is messier and more instructive than any single line can capture.
Bitcoin printed an intraday low near $60,000 on Feb. 6 before clawing back to fight around the $70,000 level as of press time, slicing through the widely watched $63,000 threshold that had anchored recent bottom-calling narratives.
However, the questions of whether the market is transitioning from forced deleveraging into genuine spot-led price discovery and what confluence of signals would confirm that shift remained.
Four zones that matter
Rather than seeking a single magic number, analysts are combining several frameworks into a demand ladder. Each rung represents a different valuation anchor, and together they map where buying pressure might actually materialize.
Zone A ranges from $70,600 to $66,900. Glassnode identifies this as a dense cost-basis cluster using its UTXO Realized Price Distribution model, indicating a high concentration of coins last moved in this price range.
After Bitcoin lost its True Market Mean around $80,200, this cluster became the nearest on-chain absorption zone.
Glassnode cautions that spot volumes remain structurally weak, meaning any relief rally risks being corrective noise unless real spot demand returns.
The implication: bounces off this zone, driven purely by leverage flush, won’t stick.
Zone B centers on $63,000 and is significant from a behavioral rather than an on-chain perspective.
Galaxy Digital’s research arm notes that a 50% drawdown from Bitcoin’s October 2025 all-time high near $126,296 lands almost exactly at $63,000, forming a clean, round-trip threshold that mirrors prior bear-market capitulation points.
The sweep below $63,000 can be read two ways: either support broke, or the market executed a classic capitulation probe before finding genuine demand.
Which interpretation proves correct depends on what happens next with flows and derivatives.
Zone C spans $58,000 to $56,000, where two major cycle-bottom anchors converge.
Galaxy explicitly identifies the 200-week moving average at approximately $58,000 and the Realized Price near $56,000 as levels that have historically marked durable cycle floors.
Glassnode independently places Realized Price at approximately $55,800. Both frameworks agree: if the current rebound fails and BTC drifts lower, this is the magnet zone where long-term capital has traditionally re-engaged.
Zone D introduces production-cost models, and this is where Plan C’s chart lives, but only as one estimate among several.
Other models place the average production cost around $87,000, implying that spot has been trading materially below that estimate and putting miners under stress.
Meanwhile, the difficulty-per-issuance model Plan C amplified pegs the cost proxy in the high $60,000s. The nuance matters: “commodities don’t trade below cost” is directionally useful but not a hard floor for Bitcoin.
Miners can operate at a loss in the short term by selling treasuries, deploying hedges, or simply hashing through the pain until the difficulty adjusts downward and lowers marginal cost.
Production cost functions less as guaranteed support and more as a stress gauge that catalyzes supply responses, such as miner capitulation or treasury liquidation, before equilibrium resets.
What rebound confirmation actually looks like
Declaring a local bottom demands more than holding a level. The best signals span derivatives, on-chain stress, institutional flows, and mining dynamics.
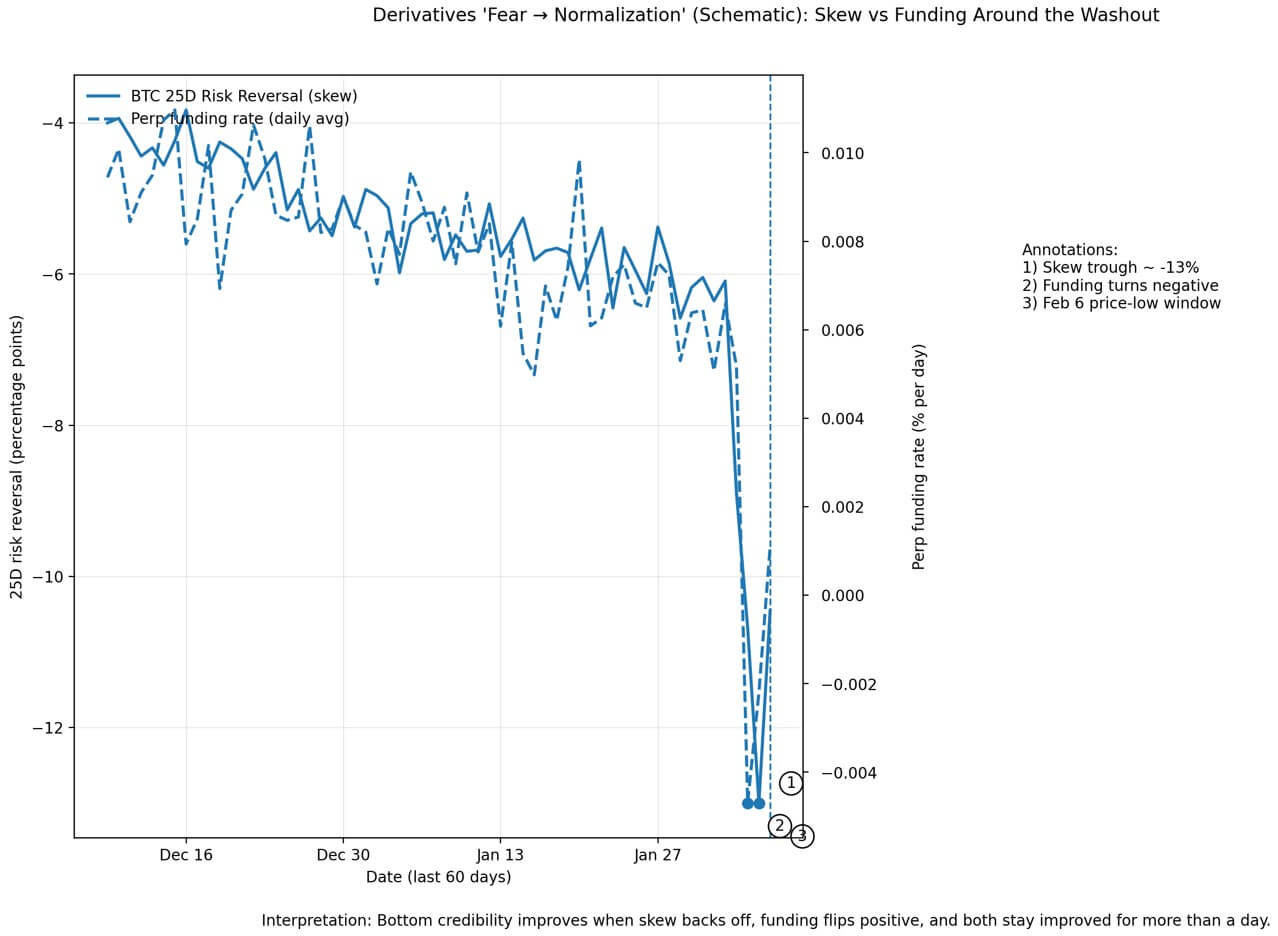
Derivatives markets are screaming fear. Deribit data show a 25-delta risk-reversal skew of approximately -13%, an inverted implied-volatility term structure, and negative funding rates. These are classic protection-bid conditions.
A rebound gains credibility when skew backs off from extreme negatives, IV normalizes, and funding flips sustainably positive.
On-chain realized losses remain elevated. Glassnode reports the seven-day moving average above $1.26 billion per day, consistent with forced deleveraging.
A bullish shift would see realized losses peak and begin to decline while price stabilizes within the $66,900-$70,600 range, indicating seller exhaustion rather than a temporary pause.
Institutional flows are a headwind. Farside Investors’ data shows nearly $690 million in monthly net outflows as of Feb. 5, adding to the $1.6 billion in net outflows registered in January.
Flow reversals don’t need to turn dramatically positive, as even deceleration to flat would matter in a thin-liquidity environment where allocators drove much of the prior rally.
Mining stress is reaching an inflection. TheMinerMag noted that the hash price fell below $32 per petahash per second, with difficulty projected to drop by approximately 13.37% at the next adjustment.
That relief could stabilize hashrate and ease miner sell pressure, but only if the price holds long enough for the adjustment to take effect.
| Signal bucket | Metric | Latest reading / regime (as of press time) | Bullish confirmation (what change you need) | Bearish continuation (what to fear) | Source |
|---|---|---|---|---|---|
| Derivatives | 25D risk reversal (skew) | Short-dated skew as low as ~-13% (puts bid / downside protection in demand) | Skew lifts toward 0 (less demand for downside hedges) and stays there for multiple sessions | Skew stays deeply negative (continued demand for protection) | Deribit Insights / Block Scholes “Crypto Derivatives: Analytics Report – Week 6” (Feb 4, 2026). (Deribit Insights) |
| Derivatives | Perp funding rates | Funding below 0% / BTC funding pushed negative (bearish positioning) | Funding turns sustainably positive (not just a one-day flip) | Funding stays negative or whipsaws (fragile bounce / short pressure persists) | Deribit Insights / Block Scholes (Week 6, 2026). (Deribit Insights) |
| Volatility | IV term structure | ATM IV term structure inverted (near-term fear priced above longer tenors) | Structure normalizes upward-sloping as spot stabilizes and panic premium fades | Structure stays inverted (market keeps pricing near-term stress) | Deribit Insights / Block Scholes (Week 6, 2026). (Deribit Insights) |
| On-chain stress | Realized losses (7D SMA) | 7D SMA > $1.26B/day (elevated forced selling / stress) | Realized losses peak then trend down while price holds Zone A ($66.9K–$70.6K) | Losses keep rising into bounces (supply still hitting bid; “relief rallies” vulnerable) | Glassnode “The Week On-chain – Bears In Control” (Feb 4, 2026). (insights.glassnode.com) |
| Flows | US spot BTC ETF net flows (month-to-date) | Feb MTD (Feb 2–5): -$689.2M (~-$690M) net (561.8 – 272.0 – 544.9 – 434.1) | Outflows decelerate to flat/positive (even “less bad” helps in thin liquidity) | Outflows accelerate (allocator selling overwhelms spot bid) | Farside Investors daily flow table (Feb 2–5, 2026). (farside.co.uk) |
| Mining | Hashprice | Hashprice fell below $32/PH/s (profitability stress) | Hashprice stabilizes/improves after difficulty relief and price holds | Hashprice falls further (higher likelihood of miner selling/treasury drawdowns) | TheMinerMag (Feb 5, 2026). (TheMinerMag) |
| Mining | Next difficulty adjustment | Projected difficulty drop ~13.37% (protocol-side relief, near-term) | Difficulty relief + stable hashrate (less capitulation; reduced forced selling) | Continued hashrate drop / sustained stress despite adjustment | TheMinerMag (Feb 5, 2026). (TheMinerMag) |
Three forward scenarios
The first potential scenario is the formation of a local bottom. Support ranges from $66,900 to $70,600 as the on-chain cluster absorbs supply. Derivatives normalize, flows stop bleeding, and realized losses cool.
Upside would first target reclaiming the True Market Mean around $80,200 before facing overhead supply from underwater holders.
The second scenario consists of a choppy drift lower. Galaxy sees a meaningful probability that BTC ranges near $70,000 before testing the $56,000-$58,000 zone in the coming weeks or months.
This fits a market where leverage has flushed, but spot demand remains absent, which is Glassnode’s central warning. Volatility persists, and relief rallies fail to sustain themselves.
The last scenario is a deeper capitulation. Another leg of forced selling, potentially triggered by continued ETF outflows or macro risk repricing, pulls BTC through the current zones.
Here, $56,000- $58,000 is less a target and more the level at which long-term capital has historically stepped in with conviction.
The real transition
The core narrative is whether Bitcoin is shifting from leverage-driven pricing back to spot-led price discovery.
Glassnode frames the market as vulnerable until spot participation returns, and that participation won’t materialize from derivatives normalization alone. Production-cost models offer a useful lens on miner economics, but they describe a supply-response mechanism rather than a price floor.
The commodity comparison breaks down when difficulty can adjust, and miners can finance operations through drawdowns.
ETF behavior now carries macro weight. Flows are large enough that capitulation increasingly manifests as regime shifts in allocator sentiment rather than just funding rate flips on offshore exchanges.
The January outflows weren’t retail panic, but rather institutional de-risking, and reversing that requires catalysts beyond technical bounces.
Bitcoin reclaimed much of the ground lost in the washout, but turning those levels into sustained demand is a different process.
The data provide a ladder of zones where demand could emerge, a checklist of confirming signals, and a reminder that production cost is the primary stress indicator rather than a floor.
Whether $60,297 marks a capitulation low or just another step in a deeper correction depends on what happens next with flows, derivatives, and the willingness of spot buyers to step in amid persistent fear.