Why I’m bullish when my $49k Bitcoin prediction is playing out as BTC closes in on major BUY ZONE


Bitcoin has a way of turning numbers into memories.
You remember the first time it ripped through a round number, $10k, $20k, $100k, you remember the mood shift when it stops rewarding optimism, you remember the quiet weeks when every bounce feels like a trap, and the loud ones when it feels like the floor has vanished.
This cycle’s defining memory is going to be $126,000.
That is the high I anchored on, the moment the tape stopped behaving like an uptrend and looked more like a distribution.
I laid that case in October when I wrote that the bear market cycle had started at $126k, and the market has been doing what it often does after a cycle peak, it bleeds confidence first, then it bleeds price.
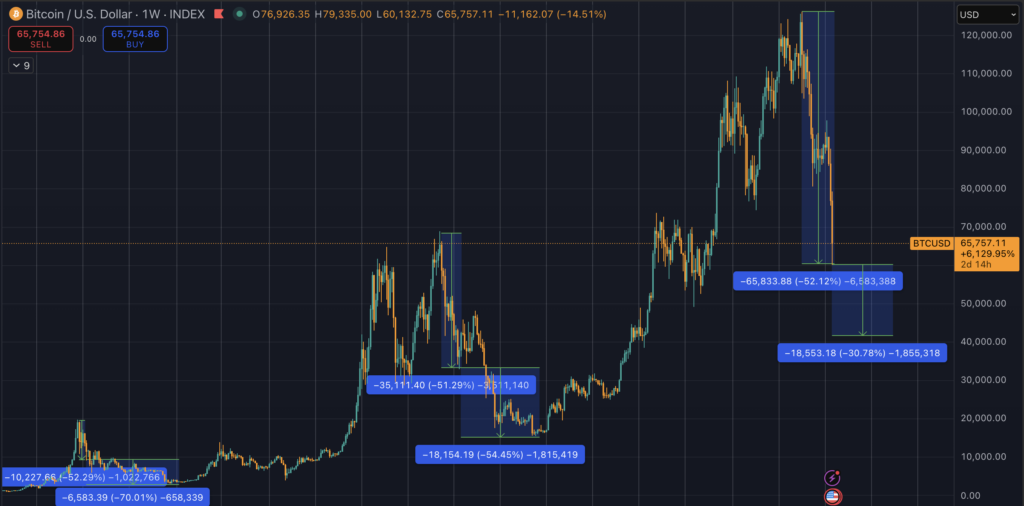
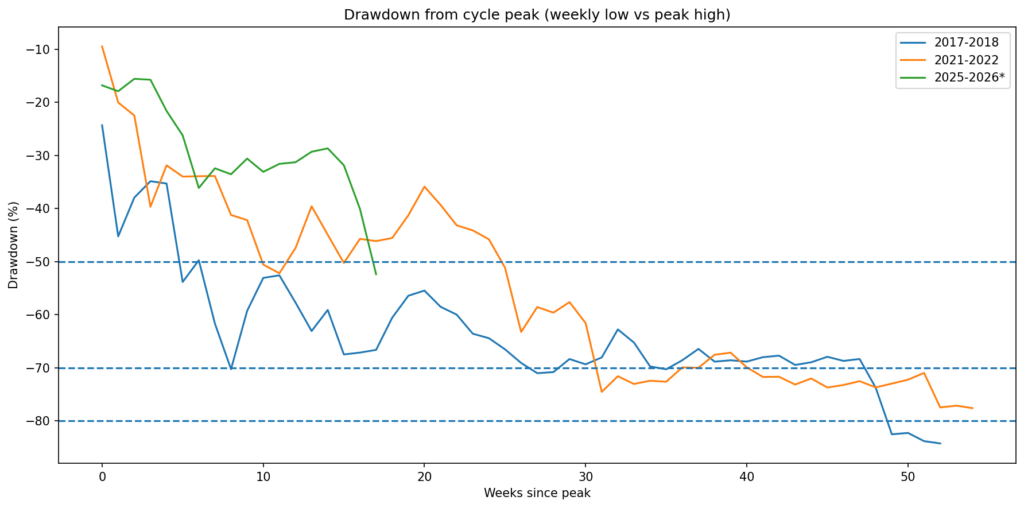
As I write this, Bitcoin is down roughly 51% from that cycle high.
On the chart, the current drawdown looks familiar enough to make you uncomfortable.
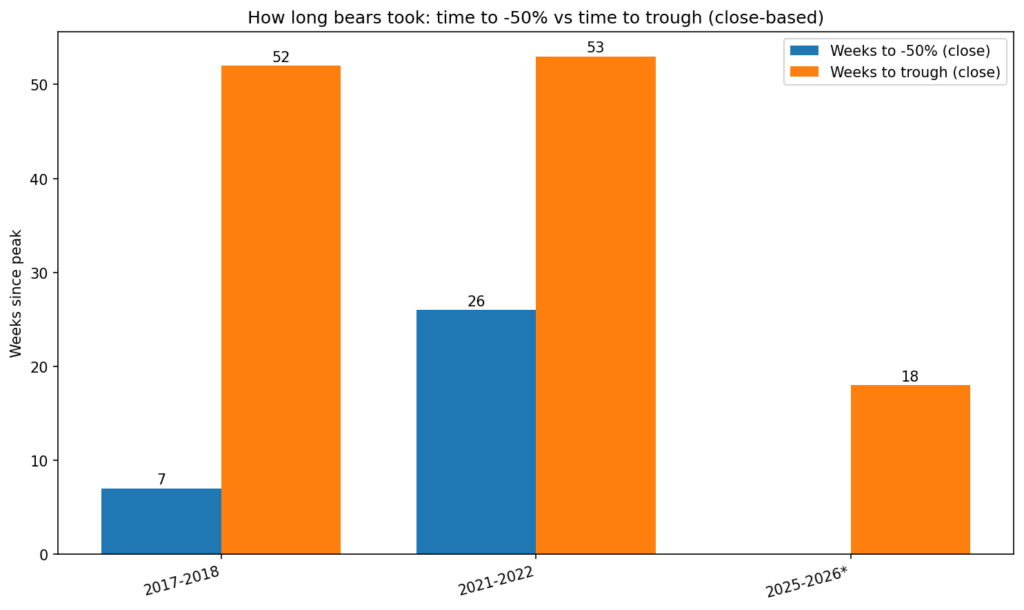
I went back through the prior major cycles and pulled every roughly 50% drop from an all time high, then I looked at what happened next.
The shape is never identical, the drivers change, the plumbing changes, the participants change, yet the human pattern repeats, denial, bargain bounces, then the moment people stop asking “is it over” and start asking “how low can it go.”
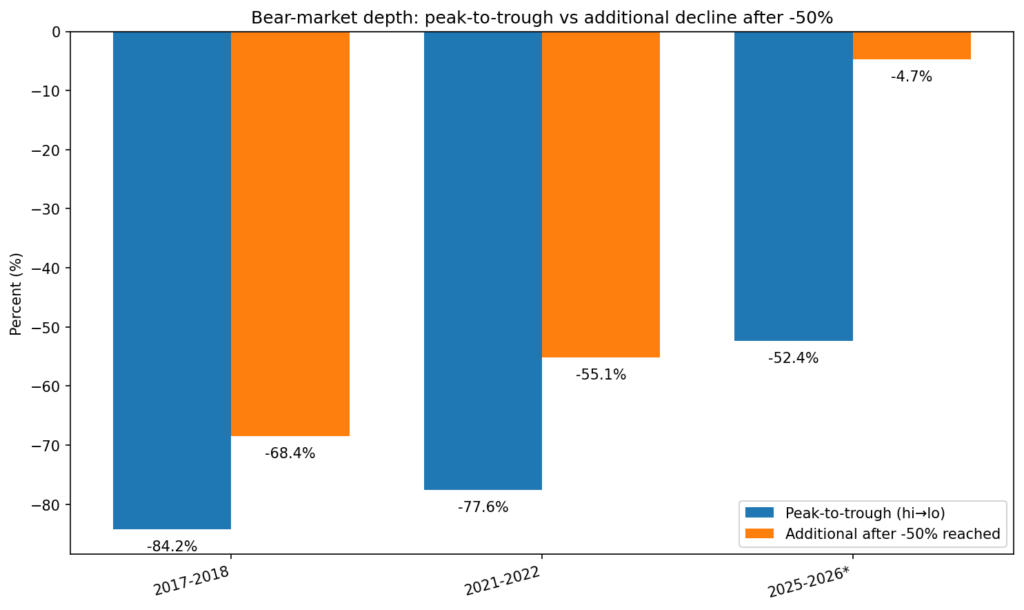
In 2018, after Bitcoin was already down around 50% from the peak, it fell another roughly 70% before the true cycle bottom was in.
In 2022, the next leg down after a 50% drawdown was smaller, closer to 50%.
If you take that diminishing severity at face value, the next “after 50” leg this cycle could be closer to 30%, best case, and if it behaves more like the old regime, it could still be much worse.
That range, another 30% to another 70% from here, is wide enough to be fairly useless on its own, but it does give us a direction.
The whole point of writing about bear markets is to narrow the problem down into something human, something you can prepare for, something you can watch in real time without losing your mind.
That is what this piece is for, to connect what I have written through this cycle with what the historical drawdown patterns show, then translate it into practical medium term levels and scenarios, with a clear set of signals that would force me to change my mind.
The moment I stopped trusting the cycle, and why the chart still matters
Before the $126k high, I spent a lot of time thinking about time.
Bitcoin has a cycle clock, it is imperfect, it is often mocked, it is still one of the few frameworks that can keep you grounded when everything around you is noise.
In September 2025 I wrote that the cycle clock pointed to a final high by late October, with the real question being whether ETFs would rewrite history. That piece was me trying to hold two truths at once, the cycle has rhythm, and the structure of this cycle is different.
Less than three weeks later, I stopped dancing around it. I wrote that time was up maing the case that the top was in and the bear market cycle started at $126k. It was a line in the sand, because I have learned the hard way that peak markets do not feel like peaks, they feel like they are getting started.
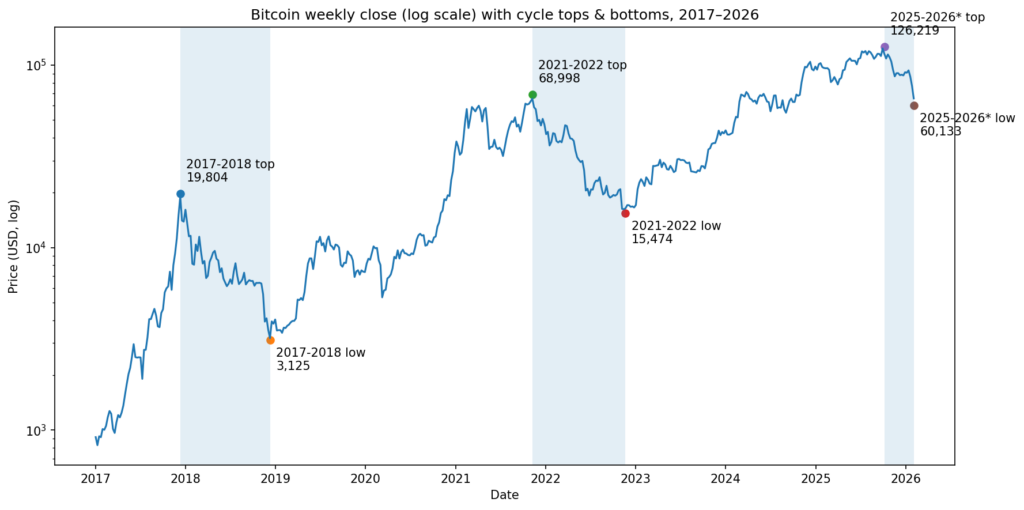
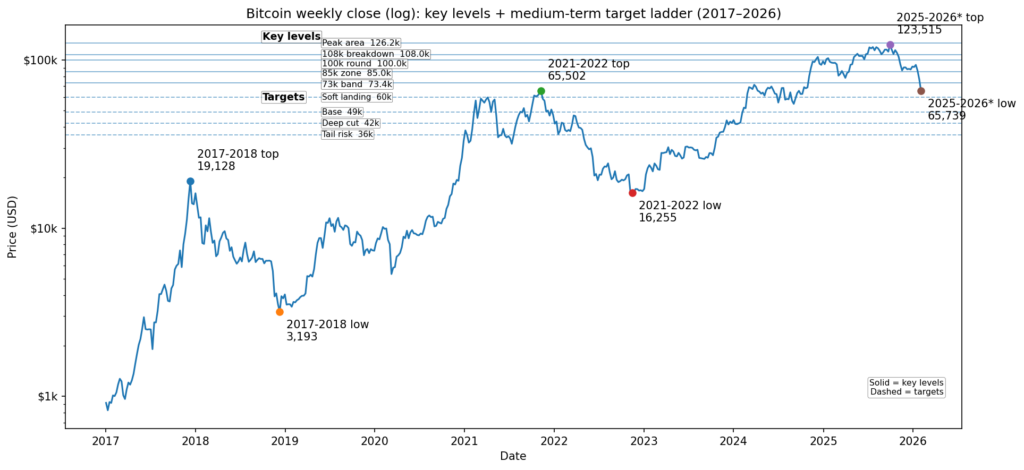
Now we have the benefit of data, and a chart that can be interrogated without ego. Using the weekly BTC chart, I marked the cycle tops using the peak week highs, then I tracked the drawdowns using the subsequent weekly lows. It is the same method for 2017 to 2018, 2021 to 2022, and 2025 to today.
Here is what that study says in plain language.
In 2017, the peak week high was about $19.8k, the bottom week low was around $3.1k, an 84% peak to trough collapse.
In 2021, the peak week high was about $69k, the bottom week low was around $15.5k, a 78% peak to trough collapse.
In 2025, the peak week high was about $126.2k, and the lowest weekly low so far is around $60.1k, a 52% drawdown so far.
While the chart can’t tell you the future, it can tell you the regime you are in. A 52% drawdown from a cycle high is not a new state for Bitcoin, it is a familiar stage of the process.
The uncomfortable part is what tends to happen next, because in the prior two cycles, “down 50” was closer to the middle than the end.
That is why I keep coming back to levels and conditions, rather than trying to win the argument with a single number.
The level map I gave you, and what it was trying to protect you from
In November, once the cycle high was in the rear view mirror, I wrote a piece that was deliberately practical, Bitcoin to $73k, be prepared with the price levels to watch during a bear market. It was my attempt to translate a scary range into stepping stones.
That map had a clear staircase.
First, the market had to deal with $85k, the kind of level that sits in the collective memory as a line between “this is a correction” and “this is something else.”
Then there was $73k, a level that matters because it is psychologically important and structurally important, it sits near a prior regime, it is where you would expect dip buyers to make a stand, and where you would expect sellers to test whether the bid is real.
Below that, I highlighted $49.8k as the lowest significant shelf, the kind of number that starts showing up in long term charts as a magnet when the market is looking for a place to be wrong in public.
A few days later I went further, and put my own name on a medium term bear thesis, that Bitcoin could fall to $49k, and that this winter could be the shortest yet. That piece was not just a price call, it was a framework with scenarios, a soft landing case, a base case, and a deep cut case, plus a set of flip levels that would tell us which path we were on.
Then January arrived, and I explained how the month delivered concerning red flags, especially because the plumbing was already straining.
That phrase, the plumbing, is where the objective part of the story sits.
Price is the headline. Plumbing is the part that breaks you in a bear market, because it turns an orderly selloff into a cascade. It is the difference between a dip that feels like an opportunity and a dip that feels like a warning.
So the medium term question becomes simple to ask, hard to answer, and very personal for anyone holding risk, does price catch down to the broken plumbing, or does the plumbing heal before we print the deeper levels?
The drawdown patterns, and why I keep talking about diminishing declines
When I compared prior drawdowns after Bitcoin had already fallen about 50% from a peak, I was not trying to create a magical formula. I was trying to quantify a feeling, that each cycle has had a different kind of pain.
In the 2017 to 2018 bear market, once you were already down around 50% from the top, there was still a brutal amount of air below the market. In the 2021 to 2022 bear market, the additional decline after that midpoint was smaller, still nasty, still enough to hurt, yet less violent than the prior cycle.
In the study I built from the data, the “additional after minus 50” decline was roughly 68% in the 2017 to 2018 cycle, and roughly 55% in the 2021 to 2022 cycle.
So yes, it is reasonable to ask whether that additional leg shrinks again.
If it shrinks again, you get a number that feels like a best case downside path from here, around another 30% lower from current levels. That is the logic behind the range, another 30% to another 70% from here, depending on whether history repeats softly or harshly.
The problem is that “from here” is a moving target, and bear markets are rarely polite. They do not descend in a straight line. They punish conviction on both sides. They create rallies that feel like salvation, and dumps that arrive right after people are sure the worst is over.
So I do not want to sell you a single forecast. Medium term targets make sense inside the historical envelope, and give you the conditions that would shift probability from one scenario to another.
Medium term targets, three scenarios, and what would force a rethink
Here is the cleanest way I can frame it, using the level map from my November pieces, the identified drawdowns, and the plumbing signals I flagged in January.
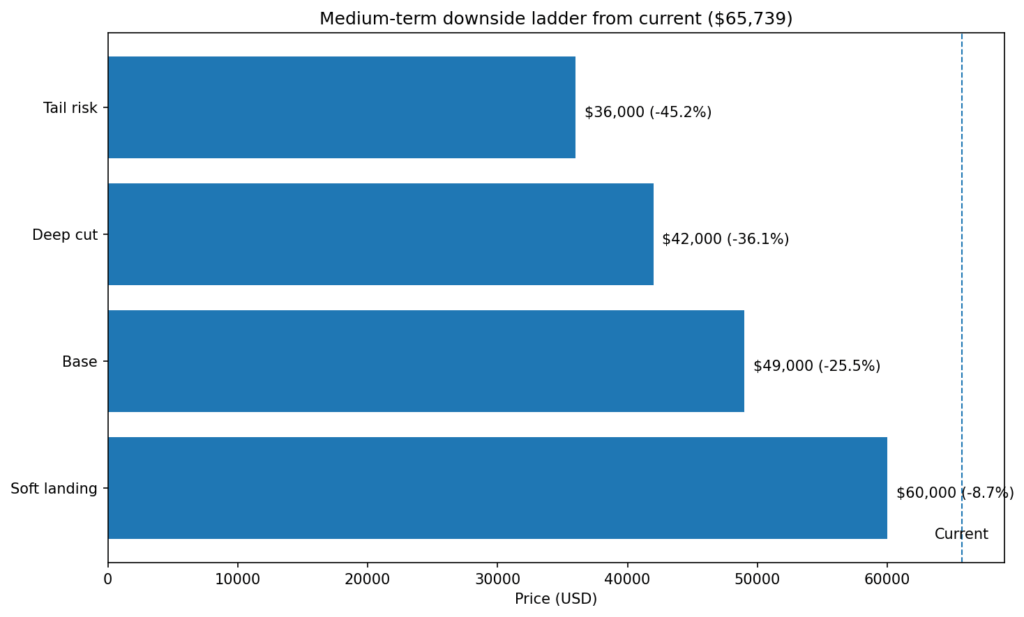
Scenario 1, the soft landing, $56k to $60k
This is the case where the market has already done most of the emotional work. It is down 50%, it has washed out late longs, it has scared weak hands, and now it transitions into a shorter winter.
I sketched this as a “soft landing” band in the thesis because Bitcoin can absolutely bottom higher than the doomers expect when structural demand stays alive.
What would make this scenario feel real is shift in the underlying signals.
In that same thesis I laid out “flip levels” that matter more than vibes, ETF flow behavior, fee share in miner revenue, and hashprice stability. If you see sustained improvement there, the odds of a higher low increase, and the market spends less time looking for a dramatic bottom.
Scenario 2, the base case, $49k
This is still my primary medium term target, for one reason that matters in bear markets, it is the level that makes the most people feel sick, but it has extremely strong historical support. Way back in 2021-2022, the mid-$40ks was where institutional buying hit fever pitch and it was repeatedly defended.
Bear market lows are social events. They are the point where narratives break. A $49k print would do that, especially for everyone who anchored their psychology to six figures.
In my November level map, I called $49.8k the lowest significant shelf, in that piece, and then in the medium term thesis I made the case for $49k as the base scenario, and I kept tracking that path into January as the plumbing began flashing more warnings, in this update.
This is also where the historical drawdown envelope stays honest. A move to $49k from a $126k high would still be a smaller overall decline than 2018 and 2022, it fits the diminishing severity theme, while still respecting the way Bitcoin tends to punish complacency.
Scenario 3, the deep cut, $36k to $42k
I included this range in the original thesis for a reason, it is the scenario you need to know exists, even if you do not want to live in it.
A deep cut is what happens when the market reprices risk as well as confidence in the structure, and that can come from any combination of persistent outflows, miner stress, fee droughts, and macro shocks.
In my thesis I framed this as a late 2026 into early 2027 risk, not as a near term certainty, and that timing matters, because deep bottoms tend to be a process, not a day.
This is also the scenario that makes the historical analogy feel more like 2018, a long grind lower with one final capitulation that nobody believes until it arrives.
The $73k question, why it matters, and why it is not the finish line
I want to return to $73k, because it is the level most people should emotionally latch onto.
In that November piece I wrote about “Bitcoin to $73k” because I wanted readers to have a plan for the first major battle. That battle is where dip buyers show up loudly, where influencers rediscover conviction, where bears take profit, and where the market decides whether it is dealing with an air pocket or a staircase.
If Bitcoin retakes $73k and the plumbing improves at the same time, the market can stabilize higher than people expect.
If Bitcoin fails to regain $73k and the plumbing continues to fray, then $56k to $60k starts to feel like the next serious destination, and $49k stops sounding dramatic and starts sounding mechanical.
That is the real value of levels in a bear market, they help you turn panic into checklists.
What would make me change my mind quickly
I do not think readers need another list of scary numbers. They need to know what to watch so they can stay sane.
The flips I care about are the same ones I laid out in the medium term thesis, and flagged again in the January update.
- If ETF flow behavior changes, if the market starts absorbing supply on red days, if the reflex to sell rallies weakens, that matters.
- If miner economics improve, if fee share becomes meaningfully supportive again, if hashprice stabilizes rather than printing new stress lows, that matters.
- If those things improve while price is still in the danger zone, then the probability weight shifts away from the deep cut and toward the soft landing.
- If those things do not improve, and price keeps breaking supports cleanly, then the base case becomes a magnet, and the deep cut remains a tail risk you keep on the table.
That is the point of a framework, it forces you to be honest when the market changes.
Closing, the human part of the bear market
I have lived through enough Bitcoin cycles to know that the hardest part is the waiting, not the drop.
It is the weeks where nothing happens, and you start imagining the worst, it is the weeks where something happens and you convince yourself it is over, it is the moment you realize your time horizon was shorter than you told yourself it was.
Right now, we are in the part of the cycle where the market has already done enough damage to feel like a bear market, and not enough damage to satisfy history’s harshest versions of what comes next. That is why you see people arguing with such certainty, because uncertainty is exhausting.
So here is my honest read, based on what I wrote at the time, what the historical drawdowns show, and what the plumbing has been signaling.
$73k is a battle, $56k to $60k is a test of whether this winter really is shorter, $49k is the base case shelf that would fit a diminishing decline cycle, and $36k to $42k is the deep cut scenario that only becomes likely if the internal stress stays broken for longer than most people are prepared for.
I do not need to be right about the exact number to be useful, I need to be early enough to help you prepare, and flexible enough to admit when the market invalidates the framework.
That is what I will keep doing, chart in one hand, plumbing gauges in the other, trying to stay objective while Bitcoin does what Bitcoin does.
This analysis reflects my personal market framework and interpretation of historical data. Nothing in this article should be taken as investment advice, nor a recommendation to buy or sell any asset. Readers should make their own decisions based on their risk tolerance and circumstances.