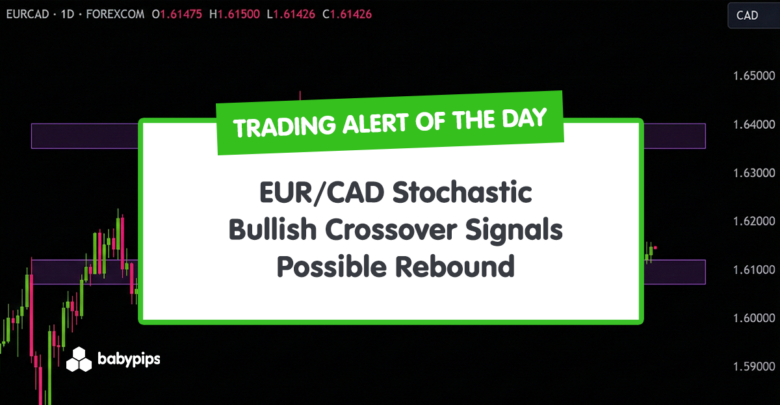
TA Alert of the Day: EUR/CAD Stochastic Bullish Crossover Signals Possible Rebound
2026-02-05 22:48:00
EUR/CAD is showing early signs of a momentum shift after spending several sessions in a subdued, oversold condition.
While price has only nudged higher, the oscillator behavior is changing in a way that often gets short-term traders’ attention.
This is the type of signal that can look “small” on the chart at first…until it either builds into a larger rebound or fails quickly and turns into a whipsaw.
Welcome to “TA Alert of the Day.” Each day after the market close, MarketMilk scans for popular technical indicator alerts. We use these alerts as the basis for a mini-lesson, breaking down what each alert means, why it matters, and how traders might interpret it. The goal is to help beginner traders not only spot these alerts but also understand the logic behind them and how they can inform trading decisions.
What MarketMilk Has Detected
EUR/CAD’s Stochastic (14,3,3) has triggered a bullish crossover, with %K (18.12) crossing above %D (17.53).
Notably, both lines are still below 20, which places the crossover in an oversold momentum zone rather than in the middle of the range.
On the chart, price has been rotating around the 1.6100–1.6150 area, with repeated tests near ~1.6070–1.6110 (support zone) and rebounds toward ~1.6205 and higher.
This crossover arrives after a late-January drop from the 1.6347 area back toward the mid-1.61s.
What This Signals
Traditionally, a Stochastic %K above %D from oversold conditions suggests that downside momentum is fading and can attract buyers looking for a mean-reversion bounce.
If the move is sustained, traders often watch for follow-through toward nearby resistance, such as the recent pivot region around ~1.6205, and then the prior swing area near ~1.6285–1.6350.
However, this same pattern can also represent a brief momentum uptick inside a continuing downswing.
In other words, oversold oscillators can stay oversold in strong trends, and bullish crossovers can fail quickly if price cannot reclaim nearby structure, sometimes coinciding with a “dead cat bounce” before another leg lower toward the ~1.6070 support zone.
The outcome depends heavily on follow-through price action, the broader trend context on the Weekly timeframe, and how EUR/CAD behaves around nearby support/resistance.
How It Works
The Stochastic measures where the close sits relative to the high-low range over the last 14 periods.
The %K line is the faster momentum line, and %D is a smoothed signal line.
A crossover where %K rises above %D is commonly treated as improving bullish momentum.
Important: Stochastic highlights momentum, not value. “Oversold momentum” (below 20) does not mean price must reverse. Strong trends can keep the oscillator pinned, and crossovers can whipsaw when markets chop sideways.
What to Look For Before Acting
Do not assume an immediate bullish reversal. Consider these factors:
✓ A daily close that continues to hold above the recent base around ~1.6120–1.6100
✓ Evidence of structure improvement (e.g., a higher low followed by a push through ~1.6155–1.6168 area)
✓ A reclaim of the nearby pivot around ~1.6205, which has acted as a rotation level in the recent swing sequence
✓ Whether the Stochastic continues rising toward/through 20 (often watched as “leaving oversold”)
✓ Signs of rejection or acceptance at resistance near ~1.6285 (late-January close) if price rebounds
✓ Alignment with the Weekly structure (trend direction, major swing levels, and whether this is a pullback or a broader breakdown)
✓ CAD-sensitive catalysts (e.g., oil volatility) and scheduled macro events that can drive gaps or trend days in FX
Risk Considerations
⚠️ Whipsaw risk: Stochastic crossovers can flip repeatedly when EUR/CAD is ranging (as it has around the mid-1.61s).
⚠️ Oversold can persist: A bullish cross below 20 can fail if the broader down-move resumes.
⚠️ Nearby resistance overhead: Upside may stall quickly into ~1.6205 before any larger recovery develops.
⚠️ Event-driven volatility: FX can invalidate oscillator signals quickly around high-impact data and central bank communication.
Potential Next Steps
EURCAD is trading within a well-defined range after a multi-month advance, with recent price action showing stabilization near the lower boundary of that range.
Selling momentum has cooled and possibly shifted to early buying momentum, but structure suggests consolidation rather than a confirmed bearish reversal. Focus on support holding and potential rotation back toward range highs.
Add EUR/CAD to a watchlist and monitor whether the price can build on this momentum shift with follow-through above nearby pivots.
Consider waiting for confirmation (such as a stronger daily close and/or a reclaim of ~1.6205) and define invalidation clearly (e.g., a breakdown back through the ~1.6100 support zone).
Primary support sits in the 1.605–1.612 zone, which has repeatedly attracted buyers and defines the lower boundary of the multi-month range. Holding this area is critical to maintaining the consolidation structure.
A sustained daily close below 1.600 would represent a structural breakdown and materially increase downside risk, shifting the bias away from range continuation.
Position sizing and stop placement should reflect that oscillator signals can be early, and sometimes wrong.
Trade Idea
Setup:
Buy EURCAD near the lower boundary of the established range, positioning for a mean-reversion move back toward the middle and upper end of the range, assuming support continues to hold.
Entry:
Stand aside and wait for EURCAD to continue stabilizing in the 1.605–1.612 zone, where range support is well defined.
Look for confirmation via tight daily candles, a higher low, or a bullish reversal candle signaling that selling pressure is being absorbed.
Enter long once the price turns higher from this area rather than anticipating the bounce prematurely.
Stop Loss:
Place the stop on a daily close below 1.600. A decisive break beneath this level would invalidate the range thesis and suggest a deeper corrective move is underway.
Take Profit:
Target the 1.620–1.625 area as an initial take-profit zone, representing the mid-range and a common reaction area.
If price continues to build acceptance above that level, trail stops and look for a move toward the 1.635–1.640 range highs, where sellers have previously reasserted control.
Bottom line: EUR/CAD remains in consolidation after a strong prior advance. As long as the 1.605–1.612 support zone holds, price action favors price rising to re-test the upper boundary.
This content is strictly for informational purposes only and does not constitute as investment advice. Trading any financial market involves risk. Please read our Risk Disclosure to make sure you understand the risks involved.