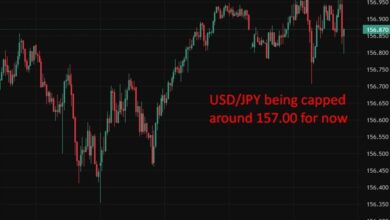
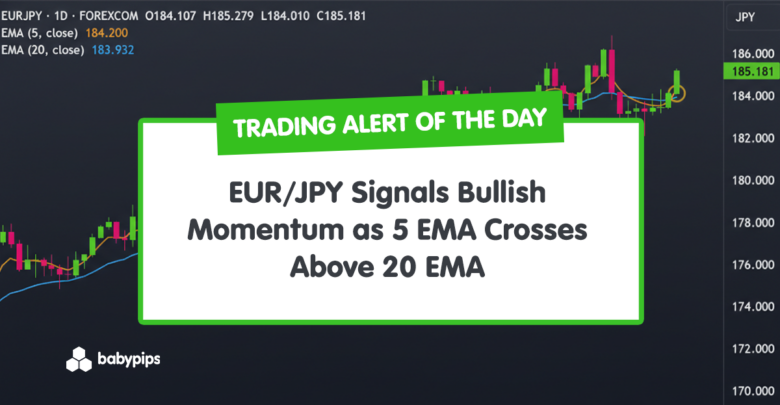
TA Alert of the Day: EUR/JPY Signals Bullish Momentum as 5 EMA Crosses Above 20 EMA
2026-02-05 00:51:00
EUR/JPY has spent much of late January chopping sideways, frustrating both trend-followers and short-term traders as the price oscillated within a tightening range.
That period of consolidation now appears to be giving way to renewed directional interest, with recent price action showing signs of stabilization and upward momentum.
After a period of quiet, back-and-forth trading, the price has started to move more decisively. Short-term indicators have begun to turn, leading to a technical signal that many traders keep an eye on.
Welcome to “TA Alert of the Day.” Each day after the market close, MarketMilk scans for popular technical indicator alerts. We use these alerts as the basis for a mini-lesson, breaking down what each alert means, why it matters, and how traders might interpret it. The goal is to help beginner traders not only spot these alerts but also understand the logic behind them and how they can inform trading decisions.
What MarketMilk Has Detected
MarketMilk detected a bullish moving-average crossover on the Daily timeframe, where the 5-day EMA has crossed above the 20-day EMA (from 183.722166/183.835437 on the prior close to 184.221110/183.967205 on the current close).
This crossover arrives after EUR/JPY rebounded from the late-January dip (lows near 181.785) and then printed a strong upswing into the 185.28 area.
EURJPY has been trending steadily higher since November, producing a clean sequence of higher highs and higher lows.
Price remains above both the rising 5-day EMA (~184.2) and 20-day EMA (~183.9), which continue to act as dynamic support levels.
The January push into the 186 area marked a local momentum high, followed by a brief pullback and shakeout that undercut short-term lows but failed to break the broader structure.
Importantly, the pullback stalled above the 20-day EMA, and recent candles show renewed buying interest and stabilization.
What This Signals
Traditionally, a 5 EMA above the 20 EMA suggests that near-term price strength is outpacing the intermediate trend, which can attract trend-following participation if the move is sustained.
In that scenario, traders often watch for continuation toward prior highs, with the 185.54–186.87 region standing out from January’s swing peaks.
However, this same pattern can also represent a late confirmation after price has already bounced sharply, meaning the crossover sometimes coincides with areas where prices briefly “look strong” before stalling.
If EUR/JPY fails to hold above the former congestion around 184.0–184.3, the crossover can degrade into a whipsaw, pulling price back toward mid-range levels and reopening the path toward 183.2–183.5.
The outcome depends heavily on follow-through after the crossover, the broader trend structure on the Weekly timeframe, and how price behaves around nearby support/resistance zones.
How It Works
The Exponential Moving Average (EMA) weights recent prices more heavily than older prices.
A 5-day EMA reacts faster to new price information than a 20-day EMA. When the faster EMA crosses above the slower EMA, it indicates that recent momentum has improved enough to overtake the intermediate average, often used as a simple way to identify potential trend transitions.
Important: EMA crossovers are lagging signals and can produce false positives when the market is ranging. Reliability often improves when the crossover occurs alongside a clean break of resistance (not just an intraday spike) and when pullbacks hold above key levels.
What to Look For Before Acting
Do not assume the uptrend will continue. Consider these factors:
✅ A Daily close holding above the 184.6–185.0 area (reduces immediate whipsaw risk)
✅ Whether price can challenge and maintain acceptance above 185.54 (prior swing high zone)
✅ A successful retest: pullback toward the rising EMAs that holds and then resumes higher
✅ The slope of the 20-day EMA turning up (not just the 5-day crossing)
✅ Fewer long upper wicks near 185.3–185.6 (sign of reduced supply overhead)
✅ Weekly timeframe alignment (trend direction and whether price is near multi-week resistance)
✅ Confirmation from broader FX drivers (ECB/BoJ policy expectations, rate-spread narrative, and risk sentiment)
✅ Awareness of upcoming event risk that can distort Daily closes (central bank commentary, inflation, jobs data)
Risk Considerations
⚠️ Whipsaw risk: late-January trade showed overlap and reversals, which can quickly invalidate crossovers
⚠️ Overhead resistance: the 185.5–186.9 zone previously capped price and may trigger profit-taking
⚠️ Gap/spike sensitivity: Daily FX moves tied to macro headlines can flip short EMAs rapidly
⚠️ Lagging signal: the crossover may occur after a large part of the rebound has already happened
Potential Next Steps
Add EUR/JPY to a watchlist and monitor whether the market can hold above 184.0–184.3 (a nearby decision zone from recent closes and the post-drop rebound).
If you trade trend signals, consider waiting for follow-through (another strong close or a constructive pullback-and-hold near the EMAs) rather than reacting to the crossover alone. Keep risk management practical.
Position sizing and invalidation levels matter more than the signal itself when the price is testing prior resistance.
Trade Idea
Setup:
Buy EURJPY on a pullback within the existing uptrend, targeting continuation after the recent consolidation near highs. The focus is on entering on weakness into support rather than chasing upside extension.
Entry:
Stand aside and wait for EURJPY to pull back or base into the 183.50–184.00 zone, where the rising 20-day EMA and prior consolidation overlap.
Look for stabilization signals such as tight daily ranges, a higher low relative to the recent dip, or a clear bullish reversal candle holding above the 20-day EMA.
Enter long once price confirms support by turning back higher from this area.
Stop Loss:
Place the stop on a daily close below 182.50. A decisive break below this level would indicate a loss of short-term trend control and raise the risk of a deeper corrective move toward the low-180s.
Take Profit:
Target the 186.00–187.00 zone as the first take-profit area, aligned with recent highs and overhead supply.
If price consolidates above that level, trail stops and look for an extension toward 188.50–190.00, where the next upside projection and psychological resistance reside.
Bottom line: EURJPY remains structurally bullish. As long as pullbacks hold above the low-183s and the 20-day EMA, weakness is best viewed as corrective consolidation within an ongoing uptrend rather than the start of a reversal.
This content is strictly for informational purposes only and does not constitute as investment advice. Trading any financial market involves risk. Please read our Risk Disclosure to make sure you understand the risks involved.