
2026-02-04 04:23:00
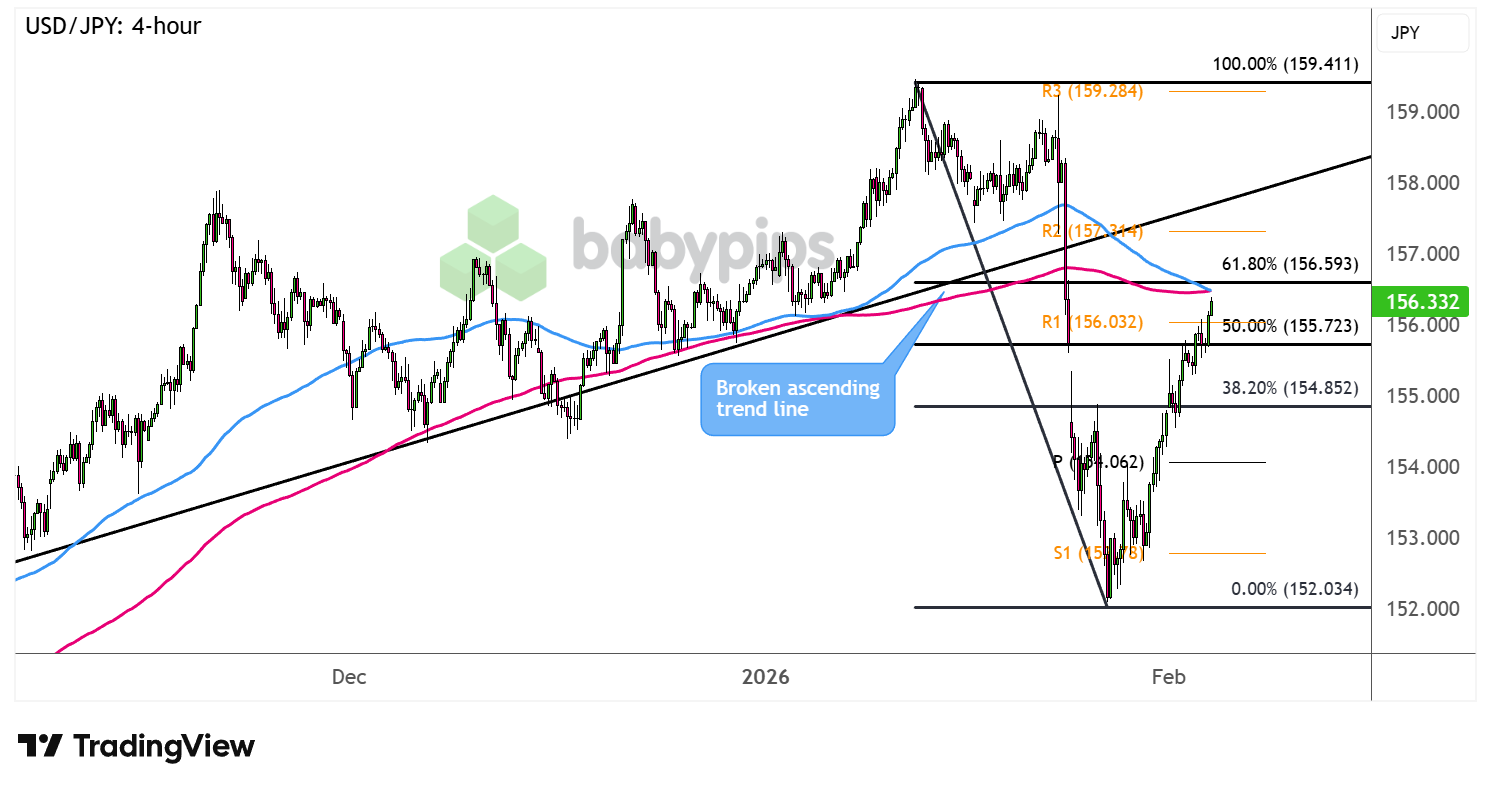
After crashing below its ascending trend line on the 4-hour time frame, USD/JPY looks prime for a pullback on its bearish reversal.
Can the downtrend still resume from here?
Take a look at these potential resistance levels!
The Greenback has been on a wild ride lately, tumbling sharply on Trump’s remarks about being comfortable with a weaker dollar then swiftly pulling higher on a hawkish Fed Chair appointee.
Meanwhile, Japanese officials have been downplaying intervention threats, spurring an unwinding of long yen positions.
Can USD/JPY keep up its climb or is it about to hit a strong ceiling soon?
Remember that directional biases and volatility conditions in market price are typically driven by fundamentals. If you haven’t yet done your homework on the U.S. dollar and the Japanese yen, then it’s time to check out the economic calendar and stay updated on daily fundamental news!
USD/JPY is closing in on the 61.8% Fibonacci retracement level around the 156.50 minor psychological mark, which could be enough to keep gains in check.
After all, this area lines up with the dynamic inflection points at the moving averages. The 100 SMA also seems to be crossing below the 200 SMA to suggest that sellers are about to regain the upper hand.
A higher pullback could still reach the broken trend line near R2 (157.31), though a break above this could suggest that longer-term bullish vibes are returning.
Keep your eyes peeled for reversal candlesticks at these levels since a return in bearish pressure could drag the pair back down to nearby support zones around the pivot point (154.06) or S1 (152.78) near the swing low.
Whichever bias you end up trading, don’t forget to practice proper risk management and stay aware of top-tier catalysts that could influence overall market sentiment.
Disclaimer:
Please be aware that the technical analysis content provided herein is for informational and educational purposes only. It should not be construed as trading advice or a suggestion of any specific directional bias. Technical analysis is just one aspect of a comprehensive trading strategy. The technical setups discussed are intended to highlight potential areas of interest that other traders may be observing. Ultimately, all trading decisions, risk management strategies, and their resulting outcomes are the sole responsibility of each individual trader. Please trade responsibly.
If you’re SERIOUS about your growth, trade journaling is the best way to track, measure and manage your performance AND psychology! Check out TradeZella, the #1 AI-powered journal and backtester to help you trade like a pro. BabyPips Premium Annual Members get an exclusive 30% discount on the annual TradeZella subscription for the first year ($120 in savings)! Click here for more info!

