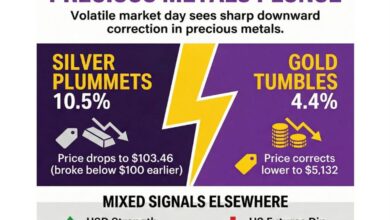
Silver dropped by more than 20% in just two days amid massive profit-taking. What’s next?

2026-01-30 11:25:00
FUNDAMENTAL
OVERVIEW
The strong bullish momentum
seems to have waned for precious metals and silver is getting hit the most
given its smaller market compared to gold. It’s not clear what caused
yesterday’s drop as pretty much all markets went down at the same time. There
were only talks of multiple US warships arriving in the Middle East but given
that oil prices dropped too, I wouldn’t bet on that reason.
Overnight, we got reports
that Trump was going to announce his Fed chair pick today and everything
suggested that it was going to be Kevin Warsh. We got a hawkish reaction across
markets as Warsh was a hawk during his last term at the Fed, although the historical
stance is never a guarantee.
The narratives underpinning
silver in the past several months have been the same as for gold, that is
de-dollarisation, geopolitical tensions, and so on. Given the lack of bearish
catalysts, the price continued to rise just by inertia. We reached a point
where it looks like just FOMO rather than something fundamental because these
prices are not justified in the short-term.
Since last week, I’ve been
turning more bearish in the short-term as I feel like we are reaching an
inflection point and February could be the first major negative month for
precious metals if the right conditions fall in place.
The most important catalyst
next week could be the US NFP report. We’ve been seeing improvements in the US
Jobless Claims data that seem to suggest a pickup in labour market activity. A
strong report would trigger a hawkish repricing in interest rate expectations
and put pressure on silver.
The other top tier data
could also start to weigh on silver if they come out strong, but the NFP report
should be the main event of the week. In case we don’t get the bearish
catalysts, silver could resume its upside trend.
SILVER TECHNICAL
ANALYSIS – DAILY TIMEFRAME
Silver – daily
On the daily chart, we can
see silver dropped by more than 20% since yesterday as profit-taking hit the
market. From a risk management perspective, the buyers will have a better risk
to reward setup around the major trendline to target new record highs. The
sellers, on the other hand, will look for a break lower to extend the selloff
into the 70.00 level next.
SILVER TECHNICAL ANALYSIS – 4 HOUR TIMEFRAME
Silver – 4 hour
On the 4 hour chart, we can
see that the price broke below the trendline that was defining the bullish
momentum on this timeframe. This is generally a signal of a loss of momentum
and potentially a bigger pullback. The sellers will likely step in around the
broken trendline with a defined risk above it to keep pushing into the next
trendline. The buyers, on the other hand, will look for a break higher to start
piling back in into longs and target new record highs.
SILVER TECHNICAL ANALYSIS – 1
HOUR TIMEFRAME
Silver – 1 hour
On the 1 hour chart, we can
see that we have a minor downward trendline defining the current bearish
momentum. The sellers will likely lean on the trendline to keep pushing into
new lows, while the buyers will look for a break higher to increase the bullish
bets into the next downward trendline around the 110.00 level. We can also
notice that the price is trading at the lower bound of the average daily range for today. In such instances, we
can generally see a consolidation or a pullback before the next move.
UPCOMING CATALYSTS
Today we conclude the week with the US PPI report and Trump’s announcement of
his Fed chair pick.