TA Alert of the Day: Bitcoin Selloff Breaches Lower Bollinger Band! Will Buyers Step In?
2026-01-30 00:30:00
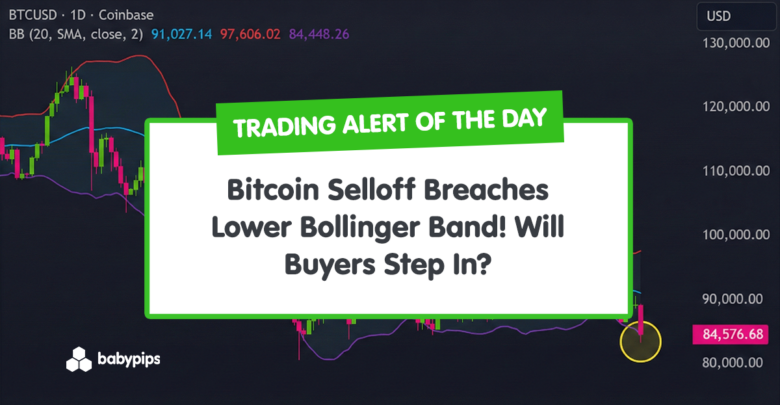
BTC/USD just had a big down day, dropping to ~84,400 and closing below the lower line of its Bollinger Bands.
When price moves this far out of its “normal” range, it often catches traders’ attention because it can signal two things: either the price may bounce back toward its average, or the downward move might continue.
In the next few days, we’ll watch how the price behaves to see which direction it’s more likely to go.
Welcome to “TA Alert of the Day.” Each day after the market close, MarketMilk scans for popular technical indicator alerts. We use these alerts as the basis for a mini-lesson, breaking down what each alert means, why it matters, and how traders might interpret it. The goal is to help beginner traders not only spot these alerts but also understand the logic behind them and how they can inform trading decisions.
What MarketMilk Has Detected
BTC/USD closed below the lower Bollinger Band (20, 2), with the close dropping from 89272.30 to 84377.35 while the lower band sits near 85231.42.
This is a notable shift because price had generally been contained within the bands in recent weeks, and today’s candle expanded range meaningfully (low near 83225.35).
After the prior peak, BTCUSD has generally been making lower highs while oscillating around the 20-day moving average, indicating a loss of the strong uptrend and a shift into a more corrective environment.
Recent price action shows a failed attempt to build on a bounce toward the middle of the Bollinger Band range, followed by a sharp downside reversal that pushed candles back through the band and into new short-term lows.
The latest candle pierces and closes outside the lower Bollinger Band, reflecting an expansion in downside volatility and a potential short-term exhaustion move if selling becomes climactic.
What This Signals
Traditionally, a close below the lower Bollinger Band can attract “mean reversion” attention, as it indicates the price has moved unusually far from its 20-day average.
If the move is sustained, traders often look for evidence of selling pressure peaking and for the price to rotate back toward the middle band (~91253) over time, especially if the next candles show stabilization and reduced downside follow-through.
However, this same pattern can also represent trend acceleration rather than exhaustion. In strong downswings, price can “walk the band,” where repeated closes near or below the lower band coincide with persistent liquidation and failed rebounds.
In that scenario, what looks like a stretch move can turn into a sequence of lower highs, and any bounce back toward ~86k–88k can sometimes act as overhead supply rather than immediate recovery.
The outcome depends heavily on follow-through price action, volatility conditions, and how BTC/USD behaves around nearby support/resistance levels. Context and confirmation are essential.
How It Works
Bollinger Bands plot a moving average (typically 20 periods) with an upper and lower band set a specified number of standard deviations from that average (here, 2).
When the price closes outside the bands, it suggests volatility has expanded, and the price has moved to an extreme relative to the recent distribution.
Important: Bollinger Bands measure stretch and volatility, not direction. A lower-band breach can precede a rebound, but it can also appear early in a larger downswing. Reliability tends to improve when the breach is followed by confirmation (e.g., a close back inside the bands, or a higher low forming near support).
What to Look For Before Acting
Do not assume a rebound is guaranteed. Consider these factors:
✅ A daily close back above the lower band (~85231) to show the breakdown is not being sustained
✅ Whether BTC/USD can reclaim and hold the ~86k–88k area (recent consolidation and frequent closes)
✅ Signs of a higher low forming after today’s ~83225 intraday low
✅ A push back toward the 20-day middle band (~91253) without immediate rejection
✅ Candle context: follow-up sessions showing smaller real bodies or long lower wicks (reduced sell urgency)
✅ How price reacts around prior reference zones from the history: ~84.2k–85.7k (late Dec/early Jan cluster) and ~80.5k (notable November swing low)
✅ Volatility normalization: bands beginning to stop widening after the spike
✅ Alignment on a higher timeframe: check the Weekly chart for whether the price is at a major structural level or still mid-range
✅ Any catalyst risk around crypto macro drivers (risk sentiment, liquidity conditions) that could keep volatility elevated
Risk Considerations
⚠️ Bear-trap vs. continuation risk: a one-day lower-band breach can reverse quickly, but it can also start a multi-day “band walk” lower
⚠️ Gap-like volatility: large daily ranges increase stop sensitivity and slippage risk
⚠️ Overhead supply: rebounds into ~86k–91k may meet sellers if the prior range becomes resistance
⚠️ False comfort from “oversold” signals: volatility extremes can persist longer than expected in trending markets
Potential Next Steps
Add BTC/USD to a watchlist and monitor whether the price closes back inside the Bollinger Bands over the next few sessions.
Immediate resistance is now near the middle Bollinger Band around the low 90,000s, where prior rallies have stalled and where a retest from below would likely encounter sellers again.
The upper Bollinger Band in the high 90,000s marks a higher resistance area, and a sustained move back above the mid band and toward that region would be needed to argue for a more meaningful bullish shift.
On the downside, there is no clear horizontal level, so treat the current area just under the lower band as short-term support and manage risk around the recent low until a clearer base forms.
Traders who prefer confirmation may wait for a reclaim of ~85231 and evidence of higher lows before treating the move as mean-reversion.
If trading this, consider position sizing that reflects the expanded daily range and define risk around nearby structure rather than relying on the band level alone.
Trade Idea
Setup:
Buy after BTC/USD forms a base near the lower Bollinger Band.
Entry:
Stand aside and wait for BTC to form a multi-day base near the lower band with smaller candles and reduced volatility. Once price breaks above that mini range and shows signs of turning back toward the middle band, enter a long position.
Stop Loss:
Place your stop just below the base low. If the price breaks down below that level and the sharp decline resumes, stay out and avoid entering.
Take Profit:
Target the 20-day middle Bollinger Band (around ~91250). This area often acts as a realistic first take-profit zone as the price reverts toward its average after an extended move.
This content is strictly for informational purposes only and does not constitute as investment advice. Trading any financial market involves risk. Please read our Risk Disclosure to make sure you understand the risks involved.