

2026-01-28 03:21:00
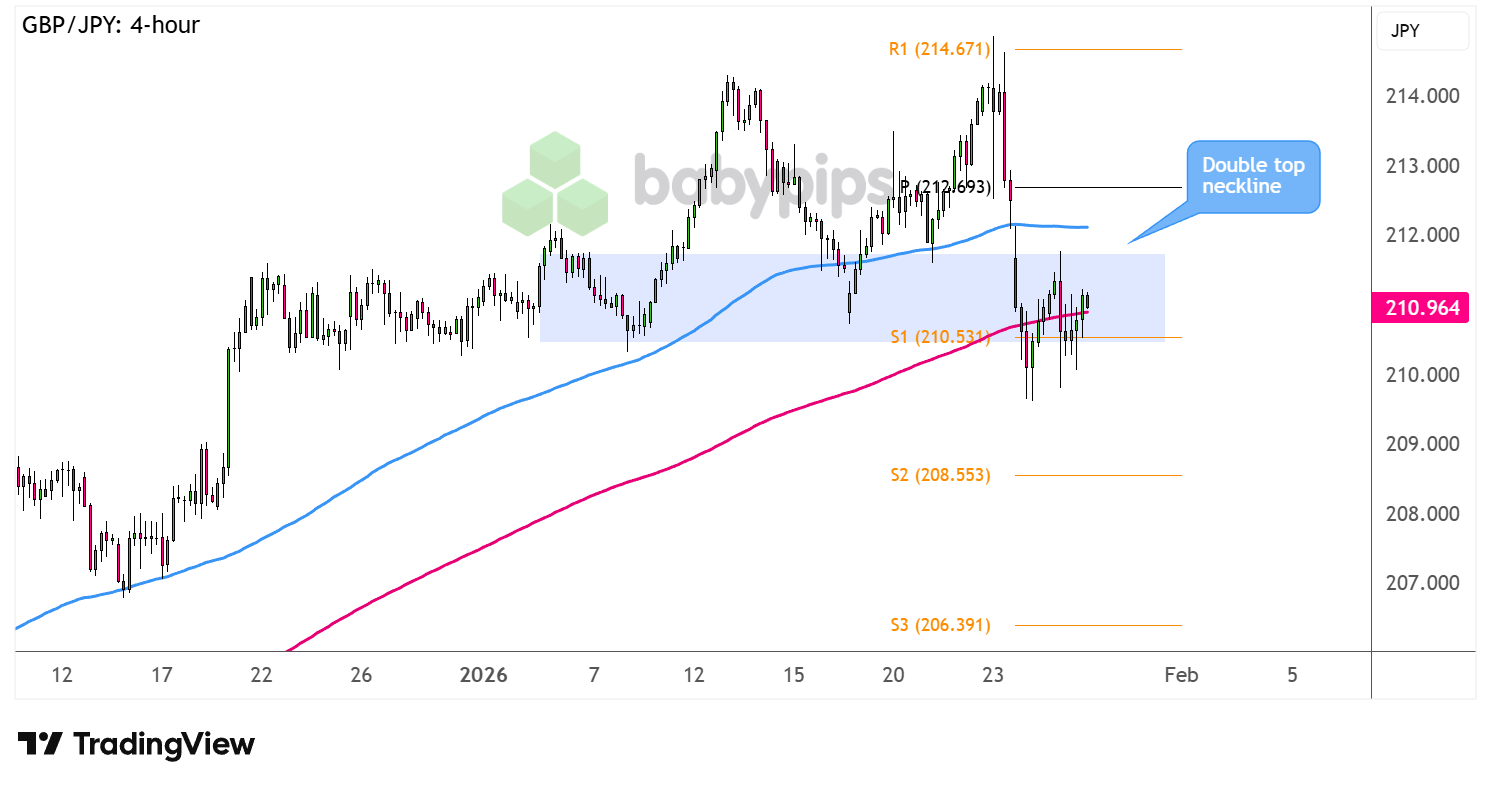
Guppy looks ready for a reversal from its uptrend, as the pair formed a double top on its 4-hour time frame.
Are we about to see confirmation soon?
Better keep close tabs on these inflection points!
Yen-tervention threats appear to be propping the Japanese currency much higher recently, capping the rally since mid-December as GBP/JPY made a couple of failed attempts to break past the 214.00 handle.
Price is now down to the neckline support around S1 (210.53) and appears to have enough bearish energy for a break lower.
How low can Guppy go if this happens?
Remember that directional biases and volatility conditions in market price are typically driven by fundamentals. If you haven’t yet done your homework on the British pound and the Japanese yen, then it’s time to check out the economic calendar and stay updated on daily fundamental news!
GBP/JPY is finding support around the 200 SMA dynamic inflection point for the time being, but the narrowing gap between the moving averages suggests that sellers could gain the upper hand soon.
If so, look out for a neckline breakdown that could clear the way for a selloff to S2 (208.55) then S3 (206.39) near the previous month lows.
On the other hand, reversal candlesticks suggesting a bounce off current levels could still take the pair up to nearby resistance zones at the pivot point (212.69) or all the way up to the highs at R1 (214.67).
In the absence of top-tier economic releases from the U.K. and Japan this week, make sure to stay alert for sentiment-related market swings coming from major events like the FOMC decision.
Whichever bias you end up trading, don’t forget to practice proper risk management and stay aware of top-tier catalysts that could influence overall market sentiment!
Disclaimer:
Please be aware that the technical analysis content provided herein is for informational and educational purposes only. It should not be construed as trading advice or a suggestion of any specific directional bias. Technical analysis is just one aspect of a comprehensive trading strategy. The technical setups discussed are intended to highlight potential areas of interest that other traders may be observing. Ultimately, all trading decisions, risk management strategies, and their resulting outcomes are the sole responsibility of each individual trader. Please trade responsibly.
Master your trading psychology with AI-powered insights TradeZella helps you track, backtest, and eliminate bad habits automatically! BabyPips Premium Annual Members get an exclusive 30% discount on the annual TradeZella subscription for the first year ($120 in savings)!

