TA Alert of the Day: USD/CHF Oversold on RSI. Incoming Bounce or Further Selling?
2026-01-27 23:20:00
The U.S. dollar has been broadly weaker across global FX markets, which has put pressure on USD/CHF and other dollar pairs.
USD/CHF just posted a sharp daily drop that pushed momentum into an extreme zone that traders often watch for inflection points.
When moves accelerate this quickly, the next few sessions can reveal whether selling pressure is peaking or simply gaining traction.
Welcome to “TA Alert of the Day.” Each day after the market close, MarketMilk scans for popular technical indicator alerts. We use these alerts as the basis for a mini-lesson, breaking down what each alert means, why it matters, and how traders might interpret it. The goal is to help beginner traders not only spot these alerts but also understand the logic behind them and how they can inform trading decisions.
What MarketMilk Has Detected
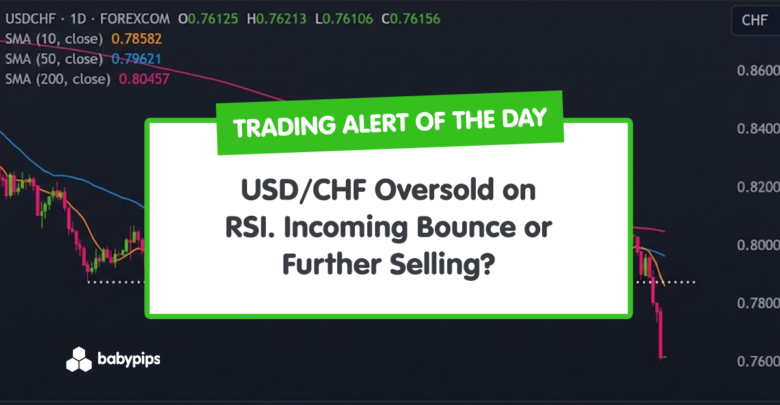
USD/CHF’s RSI (14) has reached oversold territory, falling to 23.19 after crossing below the 30 threshold.
This coincides with a large bearish daily candle (0.776905 → 0.761215) and a break to the lowest levels seen in the provided history.
For months, USDCHF has been making lower highs beneath a declining 200-day SMA, confirming a broader bearish trend.
Price spent much of late 2025 chopping around a horizontal band near roughly 0.785–0.790, but the most recent swing broke decisively below that floor on expanding downside candles, turning former support into fresh resistance.
The latest decline is steep and almost vertical, with several long red bars in a row and little intraday recovery, showing strong selling pressure and trend acceleration.
What This Signals
Traditionally, an RSI oversold reading suggests that bearish momentum has become stretched, which can attract mean-reversion buyers or profit-taking from sellers.
If the move is sustained, traders often watch for RSI to recover back above 30 alongside price stabilizing, which can sometimes mark the early stages of a corrective bounce.
However, this same pattern can also represent a market entering a stronger bearish phase, where RSI remains oversold for longer than expected while price continues to grind lower.
In that scenario, oversold becomes less a “buy” signal and more a sign of persistent downside pressure, where prices briefly bounce and then roll over again.
The outcome depends heavily on whether price can defend the 0.760 area, how quickly RSI reclaims key thresholds (30 and then 40), and whether broader USD and CHF drivers reinforce or fade the current risk tone.
How It Works
RSI (Relative Strength Index) is a momentum oscillator that compares the magnitude of recent gains to recent losses, typically over 14 periods, and plots a value between 0 and 100.
Readings below 30 are commonly labeled oversold momentum, meaning selling has dominated strongly over the lookback window.
Important: Oversold momentum is not the same as an “undervalued” market. In strong trends, RSI can stay oversold (or repeatedly return to oversold) while price keeps trending, so confirmation from price action and structure matters.
What to Look For Before Acting
Do not assume a rebound is guaranteed. Consider these factors:
✅ A daily close back above the broken area near 0.776–0.780 (shows demand returning)
✅ RSI (14) recovering back above 30, then holding higher lows on subsequent pullbacks
✅ Signs of basing near 0.760 (smaller candles, reduced follow-through, repeated defenses of the low)
✅ A bullish reversal candle sequence (e.g., strong bullish close after a failed push to new lows)
✅ Whether the next resistance zone around 0.788–0.790 (prior support) caps rebounds
✅ Alignment on a higher timeframe (check the Weekly) to see if price is near a multi-month support band
✅ Confirmation from USD drivers (rate expectations, U.S. data surprises) versus CHF safe-haven demand
✅ Volatility behavior after the large down day (does volatility compress, or does follow-through expand?)
Risk Considerations
⚠️ Oversold can persist in sustained downtrends, creating repeated “early” reversal attempts.
⚠️ The latest candle shows a strong downside range, which can lead to volatile whipsaws around intraday rebounds.
⚠️ Former support near 0.788–0.790 may act as resistance, limiting upside even if a bounce starts.
⚠️ Event risk (macro releases / central bank communication) can override oscillator signals quickly in FX.
Potential Next Steps
Keep USD/CHF on a watchlist for stabilization around 0.760 and for RSI to climb back above 30 as an early momentum reset.
More conservative traders may prefer to wait for a clear daily reversal and/or a reclaim of nearby resistance before treating the oversold reading as actionable.
Immediate resistance is now the broken shelf around 0.785–0.790, where any rebound into that zone would likely encounter supply from trapped longs and trend followers leaning short.
Dynamic resistance also comes from the 10-day and 50-day SMAs sitting well above the current price, reinforcing the idea that rallies into those moving averages may be sold while the broader downtrend stays intact.
Near term support is less clearly defined on this snapshot as price is making fresh lows, so traders must anchor risk around recent candles and oversold momentum readings rather than obvious historical demand zones.
If planning a trade, consider defining risk around nearby structure (recent lows and rebound failure points) and sizing appropriately for potentially elevated volatility following the sharp drop.