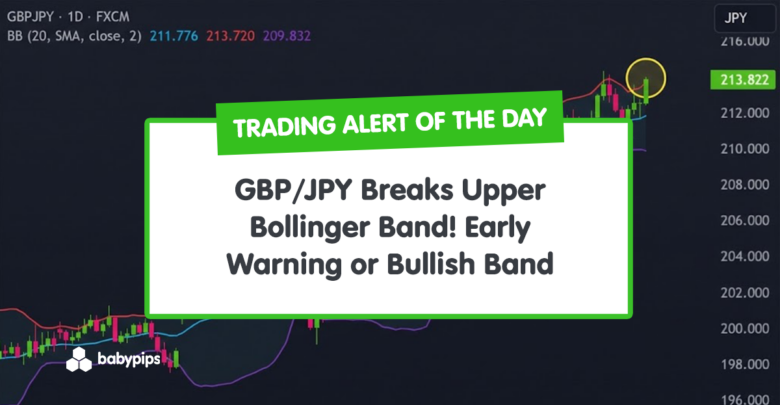
TA Alert of the Day: GBP/JPY Breaks Upper Bollinger Band! Early Warning or Bullish Band Walk?
2026-01-22 22:33:00
Article Highlights
- GBP/JPY closed above its upper Bollinger Band, signaling a short-term volatility extension.
- The move puts focus on whether price reverts toward the 20-day mean or continues a bullish band walk.
- Follow-through near the 214.10–214.30 resistance zone will be key for confirmation or rejection.
GBP/JPY just pushed into an area that often gets traders’ attention: the outer edge of its recent volatility range.
Moves like this can appear to be a sign of strength on the surface, but they can also indicate “stretch” conditions that may not persist without follow-through.
With price now extended relative to its 20-day baseline, the next few sessions can be more about confirmation than the initial spike.
Whether GBP/JPY holds near the highs, presses further along the upper band, or slips back inside the volatility envelope will help clarify if this move reflects genuine trend strength or a temporary volatility spike.
Welcome to “TA Alert of the Day.” Each day after the market close, MarketMilk scans for popular technical indicator alerts. We use these alerts as the basis for a mini-lesson, breaking down what each alert means, why it matters, and how traders might interpret it. The goal is to help beginner traders not only spot these alerts but also understand the logic behind them and how they can inform trading decisions.
What MarketMilk Has Detected
GBP/JPY’s daily close (213.917) crossed above the upper Bollinger Band (20,2), with the upper band currently near 213.796.
This places price outside its typical 20-day volatility envelope, a condition that can occur during momentum surges or late-stage extensions.
In recent history, the pair has been climbing from the early November lows near ~200.10 and has repeatedly pressed the upper band during the uptrend, including a prior expansion phase around 2025-12-18 (close ~211.035 with a notably elevated band score).
The current push also revisits the 214.10–214.30 area, which can act as nearby resistance.
What This Signals
Traditionally, a close above the upper Bollinger Band can attract mean-reversion interest, especially when it occurs in a known resistance zone.
For a bearish interpretation, traders often view this as a “price is stretched” condition, suggesting that if the move is not sustained, the price may drift back toward the middle band (currently around 211.89) as volatility normalizes.
However, this same pattern can also represent trend strength, where prices “walk the band” during persistent advances.
In that scenario, attempts to fade the move can get squeezed if GBP/JPY continues to post strong closes near the highs and holds above prior breakout areas (for example, the ~213.40–213.50 region around the latest band boundary and prior reaction zone).
The outcome depends heavily on follow-through price action, the slope of the Bollinger middle band, and whether volatility expansion is accompanied by acceptance above prior resistance.
How It Works
Bollinger Bands plot a 20-period moving average (the middle band) plus/minus a multiple of standard deviation (here, 2).
When the price closes above the upper band, it indicates the price has moved more than ~2 standard deviations above its recent average, an objective way to spot volatility expansion and “stretched” conditions.
Important: Bollinger Bands measure volatility and extension, not direction. Closes outside the bands can revert quickly in range-bound markets, but in strong trends they can persist longer than expected, so confirmation from structure (support/resistance) and subsequent candles matters.
What to Look For Before Acting
Do not assume an immediate reversal. Consider these factors:
✅ A daily close back inside the bands (back below the upper band) after this breach
✅ Evidence of rejection near 214.10–214.30 (e.g., long upper wicks or weak closes)
✅ A break back below near-term structure around 213.40–213.50 (prior “ceiling” behavior)
✅ Whether price starts gravitating toward the middle band (~211.89) rather than holding elevated
✅ 4-Hour chart alignment (e.g., lower highs forming or momentum fading) rather than relying only on the daily signal
✅ Volatility behavior: expansion followed by contraction can favor snap-back moves; continued expansion can favor “band-walk” continuation
✅ Reaction at prior support zones such as 212.25–212.65 (recent closes and pullback area)
✅ Event risk: upcoming BoE/UK data and BoJ/Japan data or shifts in rate differential expectations that can sustain or negate the extension
Risk Considerations
⚠️ Trend continuation risk: fading an upper-band break can be costly if the price “walks the band.”
⚠️ Whipsaw risk: quick closes back inside the bands can still be followed by another push higher.
⚠️ Resistance ambiguity: the 214.10–214.30 area may break cleanly, invalidating a near-term mean-reversion thesis.
⚠️ Volatility spikes: wider ranges can trigger stops even if the broader direction later reverses.
Potential Next Steps
Add GBP/JPY to a watchlist and monitor whether the next 1–3 daily candles show acceptance above the upper band or a return inside it.
If you trade mean reversion, waiting for a close back below the upper band and signs of rejection near 214.10–214.30 can help reduce false entries.
Regardless of approach, consider position sizing for elevated volatility and define invalidation levels around the most recent swing structure rather than relying on the band alone.