Key points:
Bitcoin could remain under pressure as the US-EU trade war could create a risk-off environment in the short term.
Most major altcoins have turned down from their overhead resistance levels, signaling that the bears remain in command.
Bitcoin’s (BTC) pullback is attempting to find support near $92,000, but the bears have kept up the pressure. Several crypto analysts told Cointelegraph that a US-EU trade war could create a risk-off mood in the markets.
The uncertainty has boosted gold and silver to a new all-time high, while BTC languishes. However, network economist Timothy Peterson believes that BTC will eventually catch up with gold’s rally. He said in a post on X that both gold and BTC are headed to the same place but are just taking different paths.
While the long term looks bullish, the short-term is sketchy. Trader CrypNuevo said in a X analysis thread that BTC could witness downside pressure due to the uncertainty. The 2026 yearly open of about $87,000 and the range lows of $80,500 are the critical levels to watch out for.
Could BTC and the major altcoins bounce off their support levels? Let’s analyze the charts of the top 10 cryptocurrencies to find out.
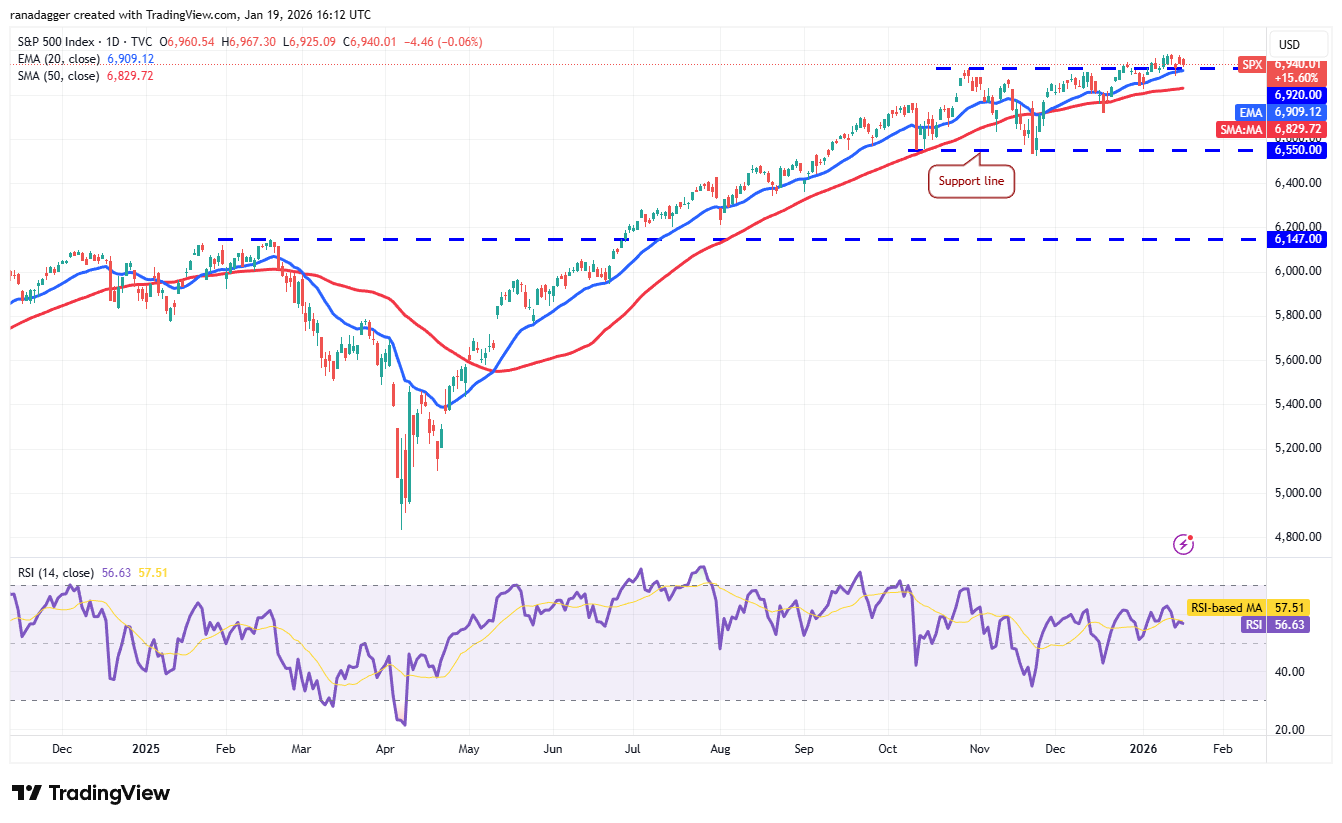
S&P 500 Index price prediction
The S&P 500 Index (SPX) is facing selling near the 7,000 level, but a positive sign is that the bulls have not ceded much ground to the bears.
The first sign of weakness will be a break below the 20-day exponential moving average (6,909). That suggests the bulls are booking profits. Buyers are expected to defend the 50-day simple moving average (6,829), as a break below it could deepen the correction to 6,720.
Contrarily, if the price rebounds off the moving averages, the bulls will attempt to resume the uptrend. If buyers thrust the price above the 7,000 resistance, the index could soar to the 7,290 level.
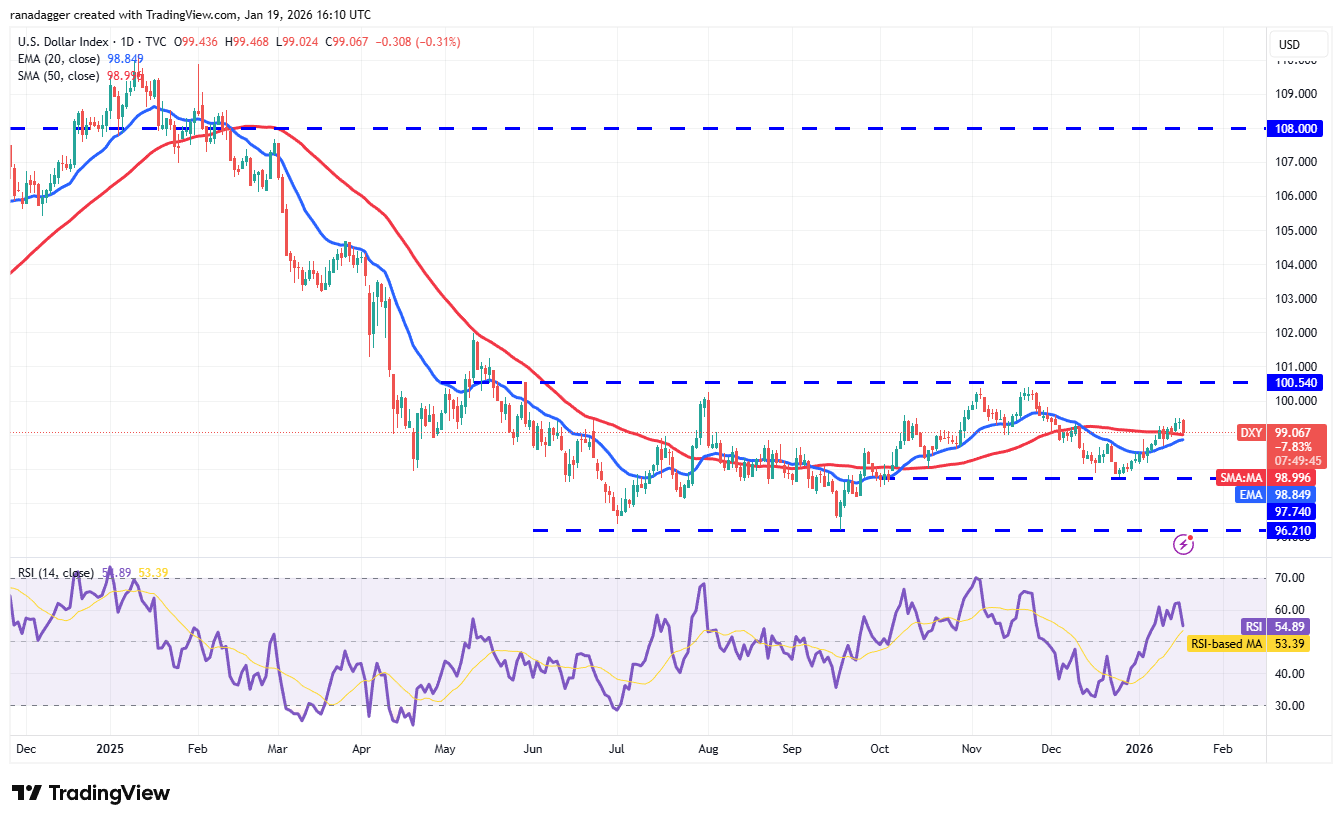
US Dollar Index price prediction
The US Dollar Index (DXY) rose above the 50-day SMA (98.99) on Tuesday, but the higher levels are attracting sellers.
If the price skids below the moving averages, the index could remain inside the 97.74 to 100.54 range for some time.
Contrary to this assumption, if the price rebounds off the moving averages with strength, it signals buying on dips. The bulls will then again attempt to drive the price to the 100.54 overhead resistance. Sellers are expected to defend the 100.54 level with all their might, as a close above it signals the start of a new up move.
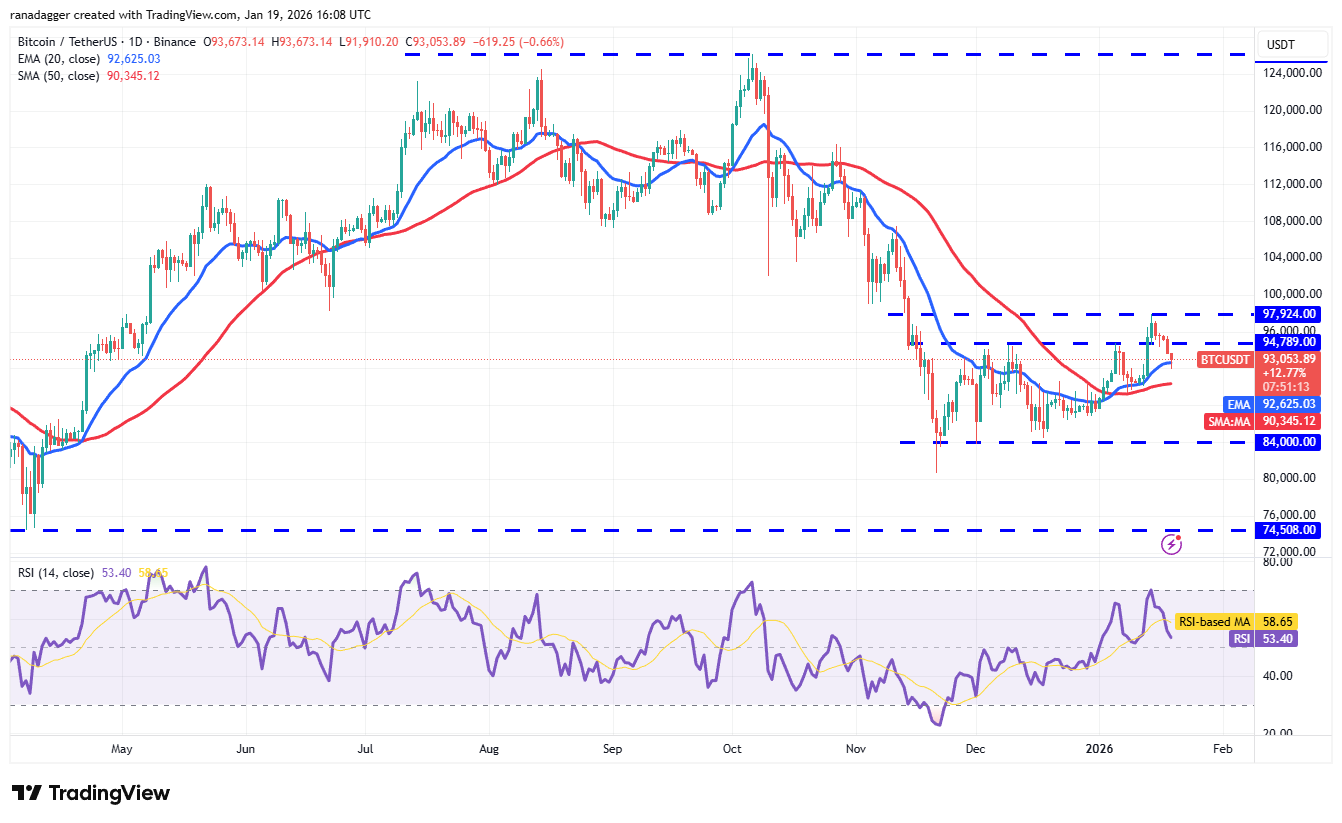
Bitcoin price prediction
BTC’s pullback has reached the 20-day EMA ($92,625), which is a critical near-term support to watch out for.
If the price rebounds off the 20-day EMA with strength, it suggests a positive sentiment. That increases the possibility of a break above the $97,924 level. The BTC/USDT pair could then rally to $100,000 and later to $107,500.
On the other hand, a break and close below the moving averages suggests that the bulls are losing their grip. The Bitcoin price may then oscillate inside the $84,000 to $97,924 range for a few days.
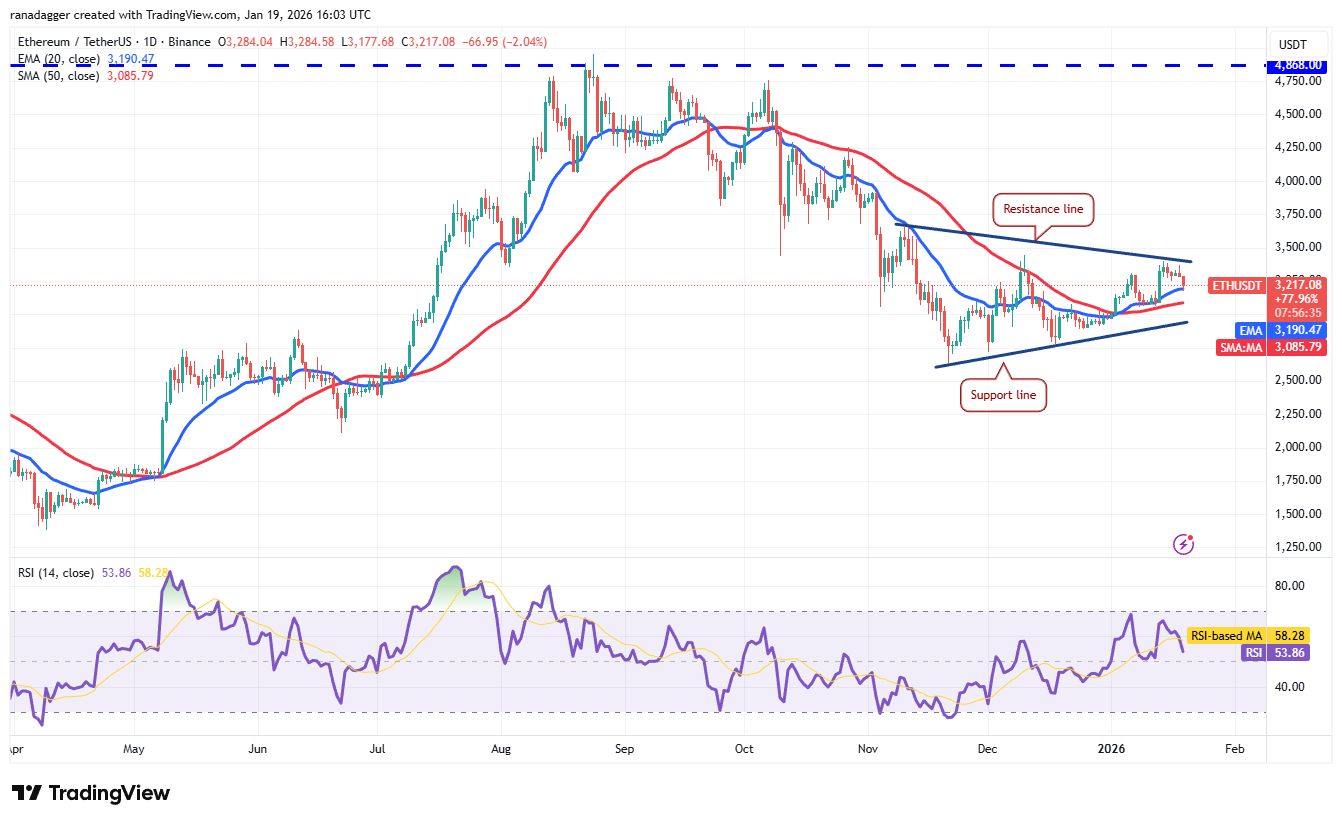
Ether price prediction
Ether (ETH) remains stuck inside the symmetrical triangle pattern, signaling uncertainty about the next directional move.
The slightly upsloping 20-day EMA ($3,190) and the RSI near the midpoint do not indicate a clear advantage either to the bulls or the bears. If the price closes below the 20-day EMA, the ETH/USDT pair may extend its stay inside the triangle.
The advantage will tilt in favor of the bulls if the Ether price closes above the resistance line. The pair may march toward $3,569 and subsequently to $4,000. On the downside, a close below the support line could sink the pair to $2,623.
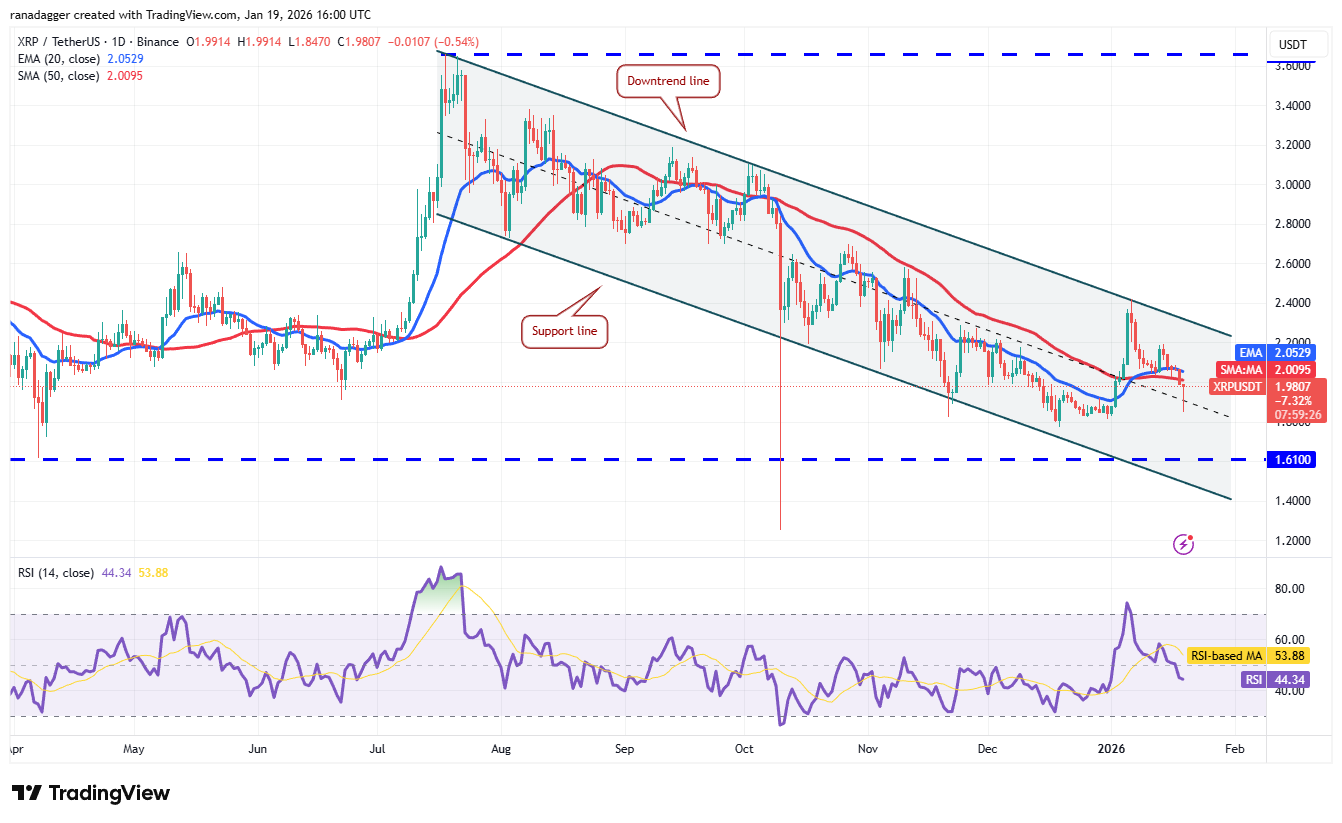
XRP price prediction
XRP’s (XRP) break below the 50-day SMA ($2) indicates that the bears are back in the game.
The bears will attempt to strengthen their position by pulling the price to the solid support zone between $1.61 and the support line. If the price rebounds off the support zone with strength, it indicates that the XRP/USDT pair could stay inside the channel for some more time.
The downside is likely to pick up momentum on a close below the support line. The par may then plummet to the Oct. 10 low of $1.25.
Buyers will have to kick the XRP price above the downtrend line to signal a potential trend change.
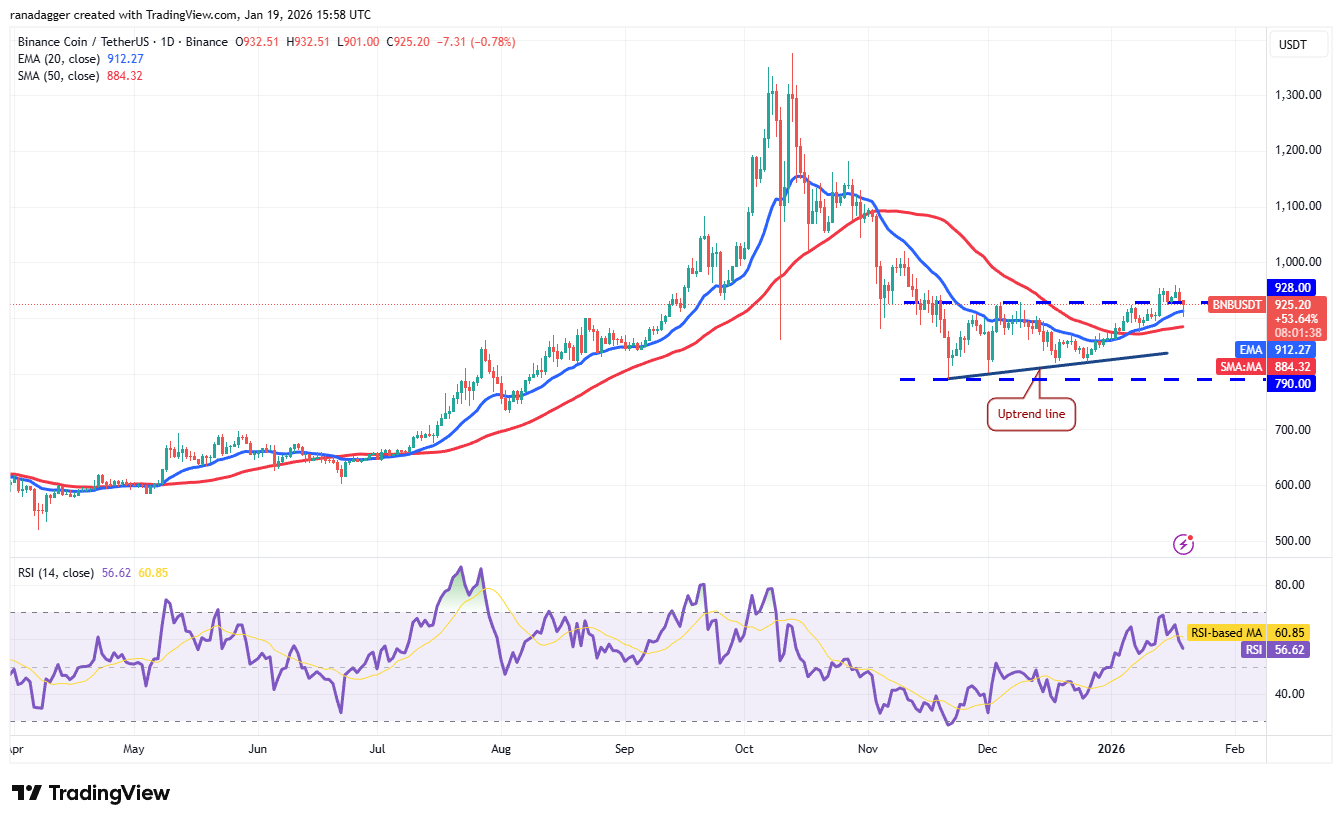
BNB price prediction
Sellers pulled the BNB (BNB) price below the 20-day EMA ($912) on Monday, but the long tail on the candlestick shows buying at lower levels.
The bulls will have to push the BNB price above the $960 level to signal the start of an up move toward the pattern target of $1,066.
Sellers are likely to have other plans. They will attempt to defend the overhead resistance and pull the BNB/USDT pair below the 50-day SMA ($884). If they do that, it suggests that the market rejected has the breakout above the $928 level. The pair may then slump to the uptrend line and eventually to $790.
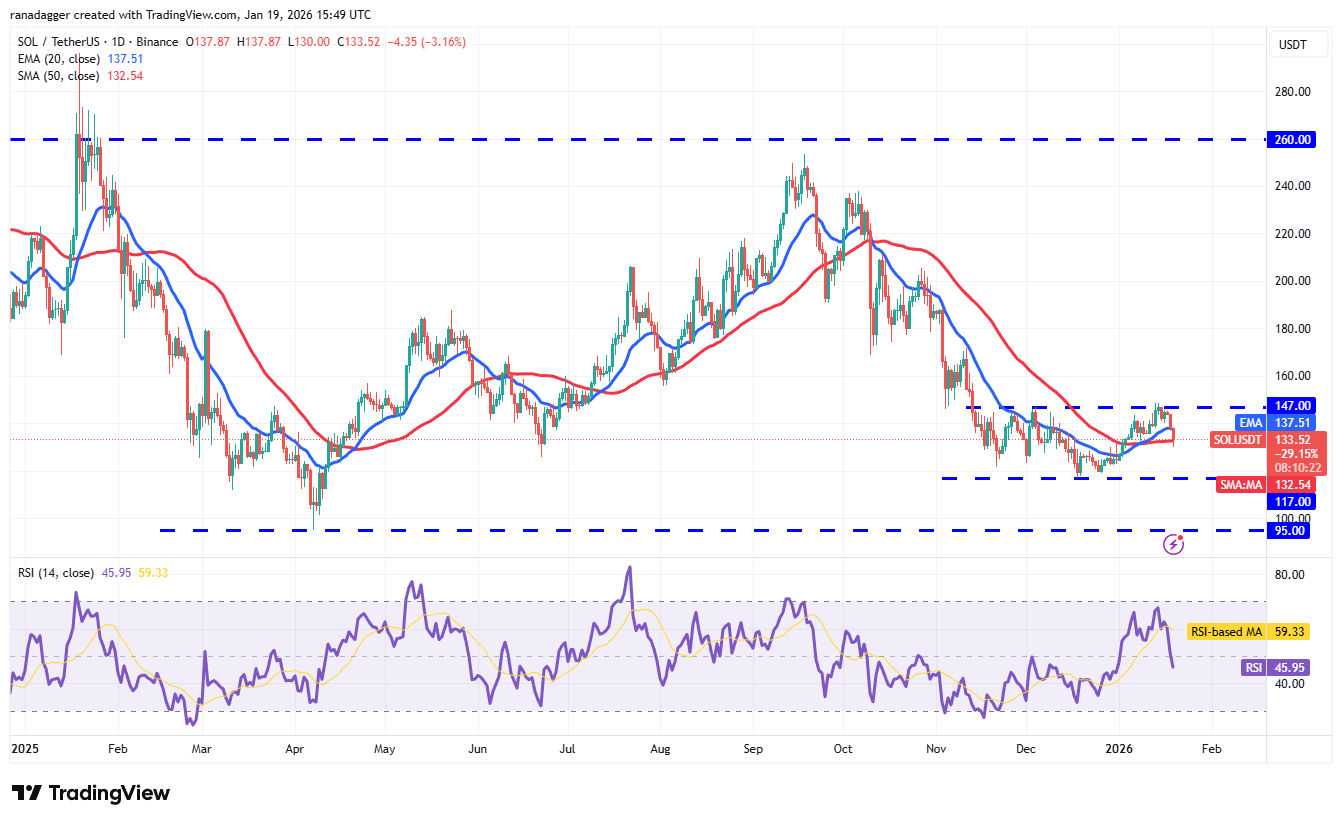
Solana price prediction
Solana (SOL) turned down from the $147 resistance and has reached the 50-day SMA ($132), indicating that the bears are active at higher levels.
Both moving averages are flattening out, and the RSI is just below the midpoint, indicating that the SOL/USDT pair could continue to consolidate between $117 and $147 for some more time.
Buyers will have to drive the Solana price above the $147 level to signal the start of a new up move. The pair could then rally to $172. On the contrary, a break below $117 could sink the pair to $95.
Related: US Bitcoin traders flip bearish: Is BTC price at risk of losing $90K?
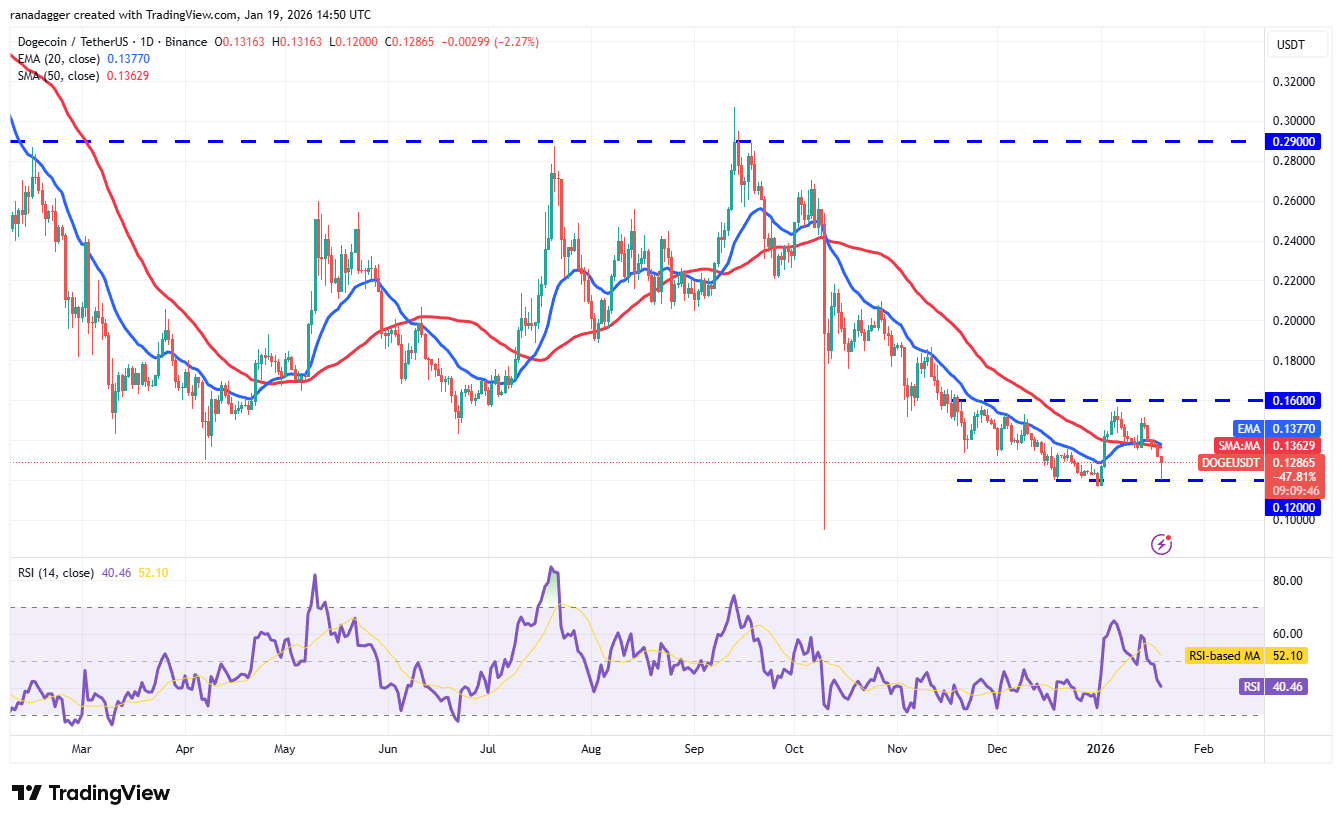
Dogecoin price prediction
Dogecoin (DOGE) fell below the moving averages on Sunday and reached the $0.12 support on Monday.
The long tail on the candlestick shows that the bulls are defending the $0.12 level. There is resistance at the moving averages, but if the bulls overcome it, the DOGE/USDT pair may continue to swing inside the $0.12 to $0.16 range for a few more days.
Instead, if the Dogecoin price continues lower or turns down from the moving averages and breaks below $0.12, it signals the resumption of the downtrend. The pair may then retest the Oct. 10 low of $0.10.
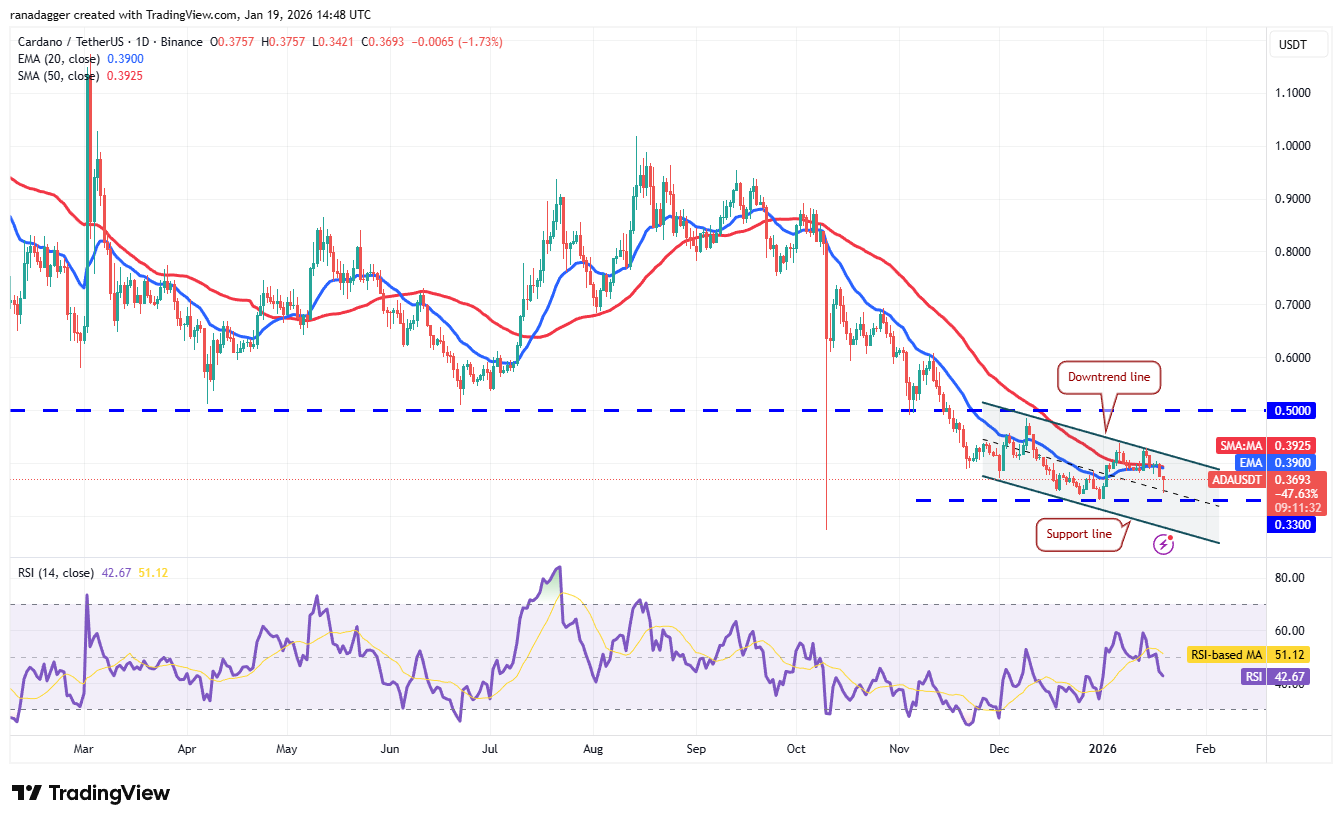
Cardano price prediction
Cardano (ADA) broke below the moving averages on Sunday and is heading toward the $0.33 support.
If the price rebounds off the $0.33 level with strength, the bulls will again attempt to propel the ADA/USDT pair above the downtrend line. If they succeed, the Cardano price could reach the breakdown level of $0.50.
Alternatively, if the price breaks the $0.33 support, the next stop is likely to be the support line of the descending channel pattern. Buyers are expected to protect the support line, which is near the Oct. 10 low of $0.27.
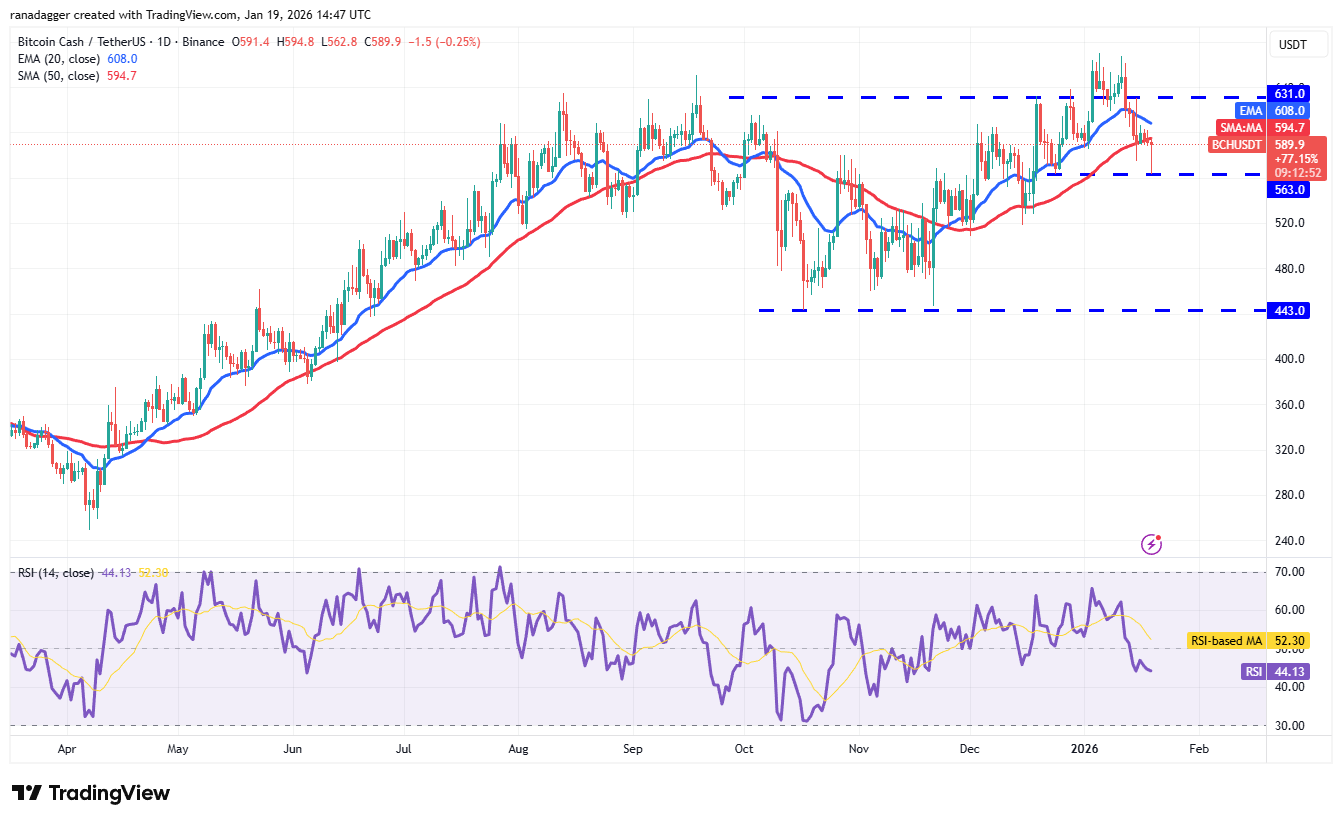
Bitcoin Cash price prediction
Bitcoin Cash (BCH) closed below the 50-day SMA ($594) on Saturday, indicating that the bears are attempting to take charge.
The 20-day EMA ($608) has started to turn down, and the RSI is in the negative territory, indicating that the bears have the upper hand. The bounce off the $563 level is expected to face selling at the 20-day EMA. If the Bitcoin Cash price turns down sharply from the 20-day EMA, the likelihood of a break below the $563 support increases. The BCH/USDT pair may then nosedive to $518.
The first sign of strength will be a break above the 20-day EMA. The pair could then rise to the $631 level, where the bears are expected to step in.
This article does not contain investment advice or recommendations. Every investment and trading move involves risk, and readers should conduct their own research when making a decision. While we strive to provide accurate and timely information, Cointelegraph does not guarantee the accuracy, completeness, or reliability of any information in this article. This article may contain forward-looking statements that are subject to risks and uncertainties. Cointelegraph will not be liable for any loss or damage arising from your reliance on this information.