2026-01-13 22:44:00
Article Highlights
- GBP/USD has slipped back toward a key support zone after a steady pullback.
- Downside momentum appears stretched, raising the possibility of near-term stabilization.
- The next few sessions may determine whether this move pauses or extends lower.
In today’s session, GBP/USD has slipped back into a support zone where downside momentum has previously cooled.
With the oscillator now flashing an oversold condition, traders may start watching for signs that sellers are losing control.
The next few sessions should clarify whether this is a pause in the decline or just another leg lower.
Let’s examine what this oversold signal may indicate for GBP/USD’s next directional move, how it has historically behaved around similar technical conditions, and which price levels traders are monitoring as potential inflection points.
Welcome to “TA Alert of the Day.” Each day after the market close, MarketMilk scans for popular technical indicator alerts. We use these alerts as the basis for a mini-lesson, breaking down what each alert means, why it matters, and how traders might interpret it. The goal is to help beginner traders not only spot these alerts but also understand the logic behind them and how they can inform trading decisions.
What MarketMilk Has Detected
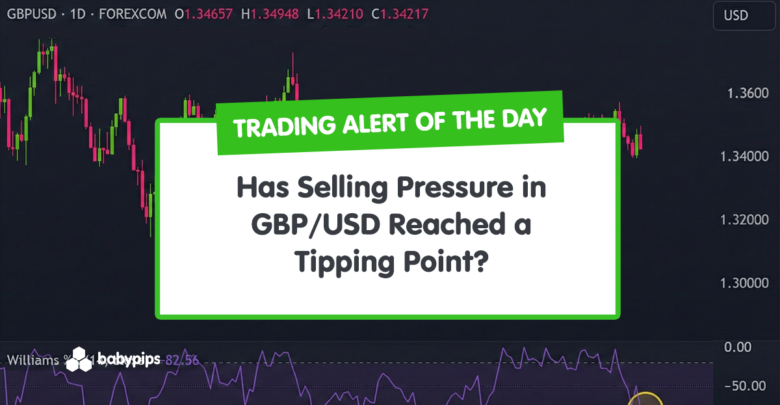
At market close today, Williams %R (14) has moved into oversold territory, falling to -82.46 and crossing below the -80 threshold.
Price closed at 1.342175 after a lower daily move, placing GBP/USD back near an area that has acted as a recent pivot around the mid-1.34s.
In the past few months, similar oversold readings tended to appear near local troughs (for example, in late October and early November), often alongside tests of lower support zones.
From the price action history, nearby levels to monitor include 1.339–1.340 (recent swing area), then 1.331–1.333 (mid-December breakdown zone), with resistance overhead near 1.349–1.352 (recent highs cluster).
What This Signals
Traditionally, an oversold Williams %R reading suggests that downside momentum has become stretched, which can attract dip-buying or short-covering.
If price stabilizes and begins to reclaim nearby resistance (such as the mid-1.34s into 1.349–1.352), it often marks the start of a mean-reversion bounce or a broader momentum reset.
However, this same pattern can also represent a strong bearish continuation where prices briefly become oversold and then stay pinned there as the trend extends.
In that scenario, oversold conditions can persist while support levels give way, and any rebounds may fail beneath prior resistance, creating a “relief rally” that fades.
The outcome depends heavily on follow-through in price action, how GBP/USD behaves around nearby support (1.339–1.340, then 1.331–1.333), and whether momentum improves as the oscillator attempts to lift back above -80. Context and confirmation are essential.
How It Works
Williams %R is a momentum oscillator that compares the current close to the highest high and lowest low over a set lookback (here, 14 periods).
It oscillates between 0 and -100, where readings below -80 are commonly treated as oversold momentum, and readings above -20 as overbought momentum.
Important: Oversold momentum is not the same as “cheap,” and it does not guarantee an immediate reversal. In trending markets, Williams %R can remain oversold for multiple sessions, so confirmation from price structure and key levels tends to matter more than the first oversold print.
Possible Scenarios Going Forward
🟢 Stabilization / Bounce Scenario
Conditions:
- Price holds above 1.339–1.340.
- Momentum starts lifting out of oversold.
Likely behavior:
- Mean-reversion bounce toward 1.346–1.349.
- Extension possible into 1.352–1.360 if momentum builds.
Nature of move:
- Initially corrective unless the structure breaks higher.
🔴 Continuation Lower Scenario
Conditions:
- Decisive daily close below 1.339.
- Momentum remains pinned oversold.
Likely behavior:
- Rotation toward 1.331–1.333.
- Potential for choppy, headline-driven selling rather than a straight flush.
What to Look For Before Acting
Do not assume a rebound is guaranteed. Consider these factors:
✅ A daily close back above 1.346–1.349 to show demand returning near the breakdown area
✅ Williams %R recovering back above -80 and continuing higher (momentum “release”)
✅ Bullish follow-through candles (e.g., higher high/higher close over 1–3 sessions)
✅ Whether 1.339–1.340 holds on retests (signs of absorption rather than quick rejection)
✅ Rejection wicks or failed breakdown attempts near 1.342 and below
✅ A break above the recent resistance band near 1.349–1.352 (prior highs cluster)
✅ Alignment check on the Weekly chart (trend structure and whether this sits at a larger support zone)
✅ Nearby event risk (UK/US inflation, labor data, central bank commentary) that can overwhelm oscillator signals
Risk Considerations
⚠️ Oversold can persist in a sustained down-move, producing early entries and multiple retests of lows
⚠️ Bear trap risk cuts both ways: rebounds can fail quickly if resistance near 1.349–1.352 holds
⚠️ If 1.339–1.340 breaks decisively, price may rotate toward 1.331–1.333, where prior structure sits
⚠️ Daily signals can be distorted around major macro releases, creating gap-like moves and invalidating neat oscillator setups
Potential Next Steps
Consider placing GBP/USD on a watchlist and tracking whether the price can stabilize above 1.339–1.340 while Williams %R works back out of oversold.
More conservative traders often wait for a daily close reclaiming 1.346–1.349 or a clean push through 1.349–1.352 to confirm that momentum is shifting.
If you decide to trade this, keep risk management practical: define invalidation around the nearby support zone, size appropriately for daily volatility, and be prepared for whipsaws if the pair remains range-bound or headline-driven.