Nasdaq Technical Analysis: The compression points to big moves once we get a breakout

2026-01-13 11:53:00
FUNDAMENTAL
OVERVIEW
The Nasdaq continues to
consolidate inside a rising wedge as traders await new catalysts and a breakout
on either side. The market maintains a bullish bias amid strengthening US economy
and the Fed’s dovish reaction function.
Yesterday, we got a brief drop
following the news of the US Department of Justice subpoenaing
the Federal Reserve.
The market saw the move as another attack against Fed independence amid Trump’s
calls to lower interest rates faster.
A potential loss of Fed
independence increases the risk of uncontrolled inflation in the future and eventually
stagflation. The probability of the loss of Fed independence though remains
very low as the consequences would be too big not only for the US but the
global economy as a whole. So, for now it’s just noise, but the market will
keep an eye on that risk.
Today, we have the US CPI report,
and it could be a major market-moving release. A hot report will likely trigger
some hawkish repricing in interest rate expectations and weigh on the market.
On the other hand, soft data should keep the rate cuts on the table and support
the upside with no more data risk.
NASDAQ TECHNICAL
ANALYSIS – DAILY TIMEFRAME
Nasdaq – daily
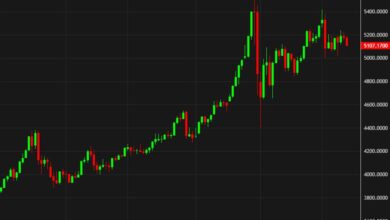
On
the daily chart, we can see that
the Nasdaq has been compressing into a rising wedge. These types of patterns can resolve into a downside breakout taking the
price to the base of the wedge or an upside breakout leading to a strong rally
after the consolidation. In this case, a downside breakout could take us to the
24,900, while an upside breakout should lead to new all-time highs.
NASDAQ TECHNICAL
ANALYSIS – 4 HOUR TIMEFRAME
Nasdaq – 4 hour
On
the 4 hour chart, we can see more
clearly the choppy price action inside the wedge as traders await a breakout. The
sellers will likely continue to step in around the top trendline to keep
targeting the bottom trendline and eventually a breakout. The buyers, on the
other hand, will want to see the price breaking higher to increase the bullish
bets into new all-time highs.
NASDAQ TECHNICAL
ANALYSIS – 1 HOUR TIMEFRAME
Nasdaq – 1 hour
On the 1 hour chart, there’s
not much we can add here as the sellers will continue to target the bottom
trendline, while the buyers will look for an upside breakout or a pullback into
the bottom trendline to position for new highs with a better risk to reward
setup. The red lines define the average daily range for today.
UPCOMING CATALYSTS
Today we have the US CPI report. Tomorrow, we get the November US Retail
Sales and US PPI reports, so it’s going to be old data. We also have a
potential US Supreme Court decision on Trump’s tariffs tomorrow. On Thursday,
we get the latest US Jobless Claims figures.