2026-01-08 23:30:00
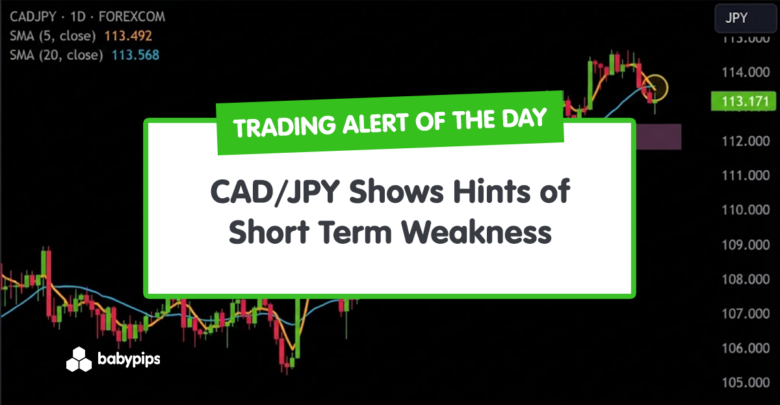
The short-term trend on CAD/JPY has just weakened relative to the medium-term backdrop, triggering a fresh moving average crossover.
This development appears after an extended climb from the 108–110 area to above 114, where the price recently stalled.
Bearish traders waiting for potential fatigue in the prior uptrend may find this crossover worth monitoring.
Welcome to “TA Alert of the Day.” Each day after the market close, MarketMilk scans for popular technical indicator alerts. We use these alerts as the basis for a mini-lesson, breaking down what each alert means, why it matters, and how traders might interpret it. The goal is to help beginner traders not only spot these alerts but also understand the logic behind them and how they can inform trading decisions.
What MarketMilk Has Detected
At market close today, MarketMilk has detected that the fast SMA(5) has crossed below the slower SMA(20).
On the previous bar, the 5 SMA was slightly above the 20 SMA (113.7368 vs. 113.6944), while on the latest completed candle, it has slipped below (113.5010 vs. 113.7031), indicating a short-term loss of momentum.
This comes after CAD/JPY pushed up from the mid-October lows near 107.0–108.0 to highs above 114.0 in late December, with notable resistance forming around 114.30–114.50.
Recent closes have eased back toward the low 113s, suggesting that the pair is pulling away from that resistance band while the averages roll over.
What This Signals
Traditionally, a 5 SMA crossing below a 20 SMA is viewed as a short-term bearish signal.
It suggests that recent prices are starting to trade below their medium-term trend baseline, which can attract traders looking for an early indication of a possible correction or trend shift lower.
If this bearish crossover is sustained and price continues to trade under the 20 SMA, it often marks a period where sellers may begin to test prior support zones, such as the recent pullback areas around 112.50–112.75 and 111.50–112.00.
However, this same pattern can also represent a temporary pause within a larger uptrend rather than a full reversal.
In choppy or range-bound conditions, fast/slow SMA crossovers are prone to whipsaws, where prices briefly dip, trigger the crossover, and then resume higher, especially if support levels like 112.50 or 111.80 hold and price quickly regains the 20 SMA.
In such cases, the bearish crossover can coincide with short-lived profit-taking rather than sustained downside pressure.
The outcome depends heavily on whether price action confirms the crossover, the broader trend context (still broadly higher from the 107–108 base), and how CAD/JPY behaves around nearby support and resistance levels.
How It Works
This alert is based on a moving average crossover between the 5-period and 20-period simple moving averages.
The SMA(5) is the average of the last five closing prices, making it very sensitive to recent moves, while the SMA(20) smooths over roughly four times as many bars, providing a medium-term trend snapshot.
When the fast average crosses below the slow one, it indicates that recent prices have weakened relative to the medium-term baseline, which is often interpreted as an early bearish development.
Important: Moving averages are lagging indicators because they are based on past prices. In sideways or volatile ranges, fast/slow SMA crossovers can occur frequently and generate false or late signals. Their reliability tends to improve when aligned with a clear existing trend, key support/resistance reactions, and confirmation from additional tools such as price patterns, higher-timeframe trends, or momentum indicators.
What to Look For Before Acting
Do not assume a sustained downtrend is underway. Consider these factors:
- Price closing behavior around the 20 SMA – Does CAD/JPY start closing decisively below the 20 SMA, or does it quickly reclaim it, suggesting the crossover is a whipsaw?
- Reaction at recent support levels – Watch how price behaves near 112.50–112.75 and the 111.50–112.00 region; firm bounces here would weaken the bearish narrative.
- Structure of the broader trend – On a higher timeframe, such as the Weekly chart, is CAD/JPY still in a clear uptrend from the 107–108 area, or are you seeing topping characteristics developing?
- Confirmation from momentum indicators – Do RSI or other oscillators show waning upside momentum or emerging bearish divergence, or are they stabilizing/turning up?
- Volatility conditions – Is volatility expanding as price moves lower (supporting a shift in sentiment), or is the market still range-bound with small candles around 113?
- Behavior around the 113.80–114.50 resistance zone – A failure to break back above this recent resistance band would support the idea of a maturing uptrend; a strong close above it would undermine the bearish crossover.
- Cross-asset and macro context – CAD/JPY is sensitive to risk sentiment and oil prices (supporting CAD) as well as safe-haven flows into JPY. Are broader markets in risk-on mode (which can support CAD/JPY) or risk-off (which can support JPY)?
- Upcoming CAD and JPY economic events – Central bank decisions, inflation data, or employment releases can quickly invalidate technical setups or accelerate a move that the crossover is hinting at.
- Alignment with your trading timeframe – Ensure this crossover on the current timeframe aligns with your holding period; short-term signals may not be relevant for longer-term swing or position trades.
Risk Considerations
⚠️ Whipsaw risk in ranging markets. In sideways conditions, fast/slow SMA crossovers can reverse quickly, leading to multiple small losses if traded mechanically without additional confirmation.
⚠️ Lag versus actual turning points. Because moving averages lag price, the crossover may occur after a significant portion of the move has already happened, or just as price is about to snap back.
⚠️ Ignoring key support and resistance. Entering solely on the crossover without considering nearby technical levels (like the 112.50 and 111.50–112.00 support or 114.00–114.50 resistance) can lead to trades directly into strong barriers.
⚠️ Macro event risk. Sudden shifts in risk sentiment, energy prices, or central bank communication affecting CAD and JPY can override the signal, causing sharp moves against technically driven positions.
Potential Next Steps
You may wish to keep CAD/JPY on your watchlist to see whether price action starts to respect the bearish crossover by remaining below the 20 SMA and pressuring nearby support levels.
Many will look for additional confirmation, such as a breakdown through recent lows, weakening momentum, or alignment with the Weekly trend, before acting on the signal.
No matter how you trade, make sure your trade size is appropriate, your stop loss is set ahead of time, and you have a clear plan for dealing with increased volatility around major economic news.