
Zcash’s technical and fundamental catalysts raise the odds of ZEC price declining to as low as $200 in the coming weeks after core developers exited the project.
Zcash (ZEC) slid more than 20% on Thursday to around $381, marking its weakest price level in three weeks, as markets reacted to the sudden resignation of the core development team from the Electric Coin Company (ECC).
Key takeaways:
Former CEO Josh Swihart confirmed that the team will form a new company to continue privacy-focused development. But his assurance failed to lift the market’s mood, prompting many analysts to predict further declines in Zcash prices ahead.
But how low can the ZEC price go?
Zcash descending channel raises 40-50% crash odds
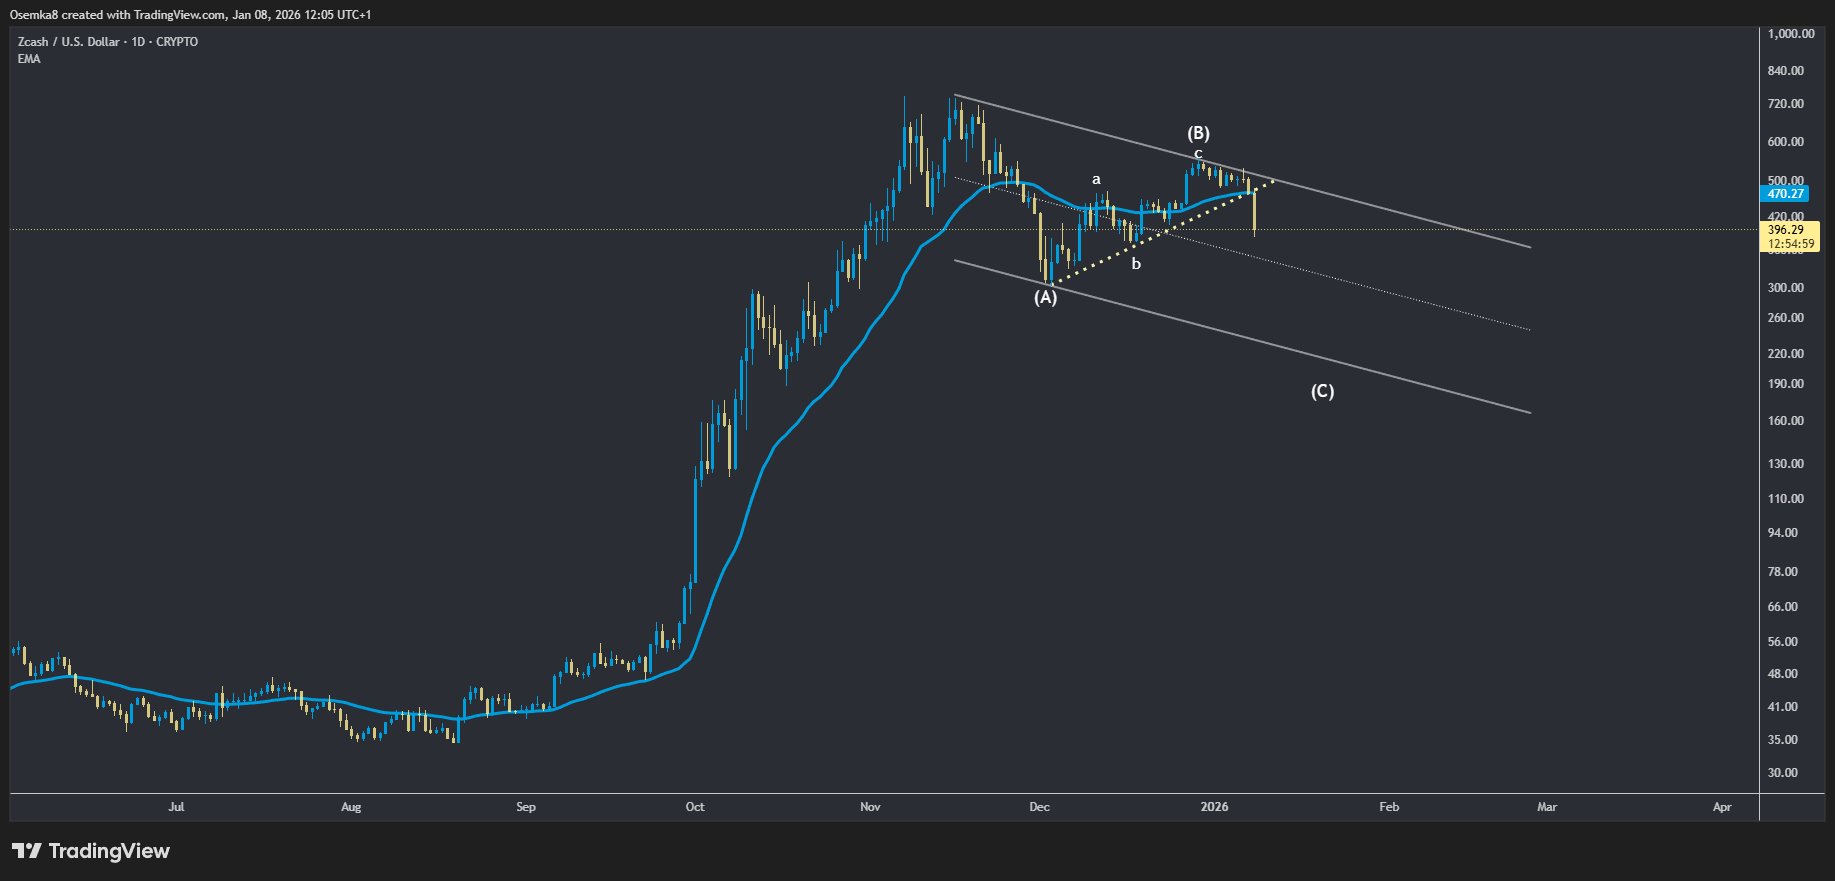
ZEC’s price can drop another 40-50% in the coming weeks, according to a technical setup shared by analyst Osemka.
The price started correcting after testing the upper trendline of its prevailing descending channel pattern, resembling a pullback from November that resulted in a 58% correction a month later.
Simultaneously, ZEC’s price broke below a support confluence comprising a rising trendline and a 20-day exponential moving average (20-day EMA; the blue wave in the chart above).
While the rising trendline had supported its 85% recovery move in the past month, the 20-day EMA capped Zcash’s downside attempts during the 1,000%-plus rally in late 2025.
Related: Zcash backer Bootstrap says split due to clash over nonprofit rules, Zashi future
Breaking below this confluence raised ZEC’s odds of falling toward the ascending channel’s lower trendline, roughly around the $200-250 area, in the coming weeks.
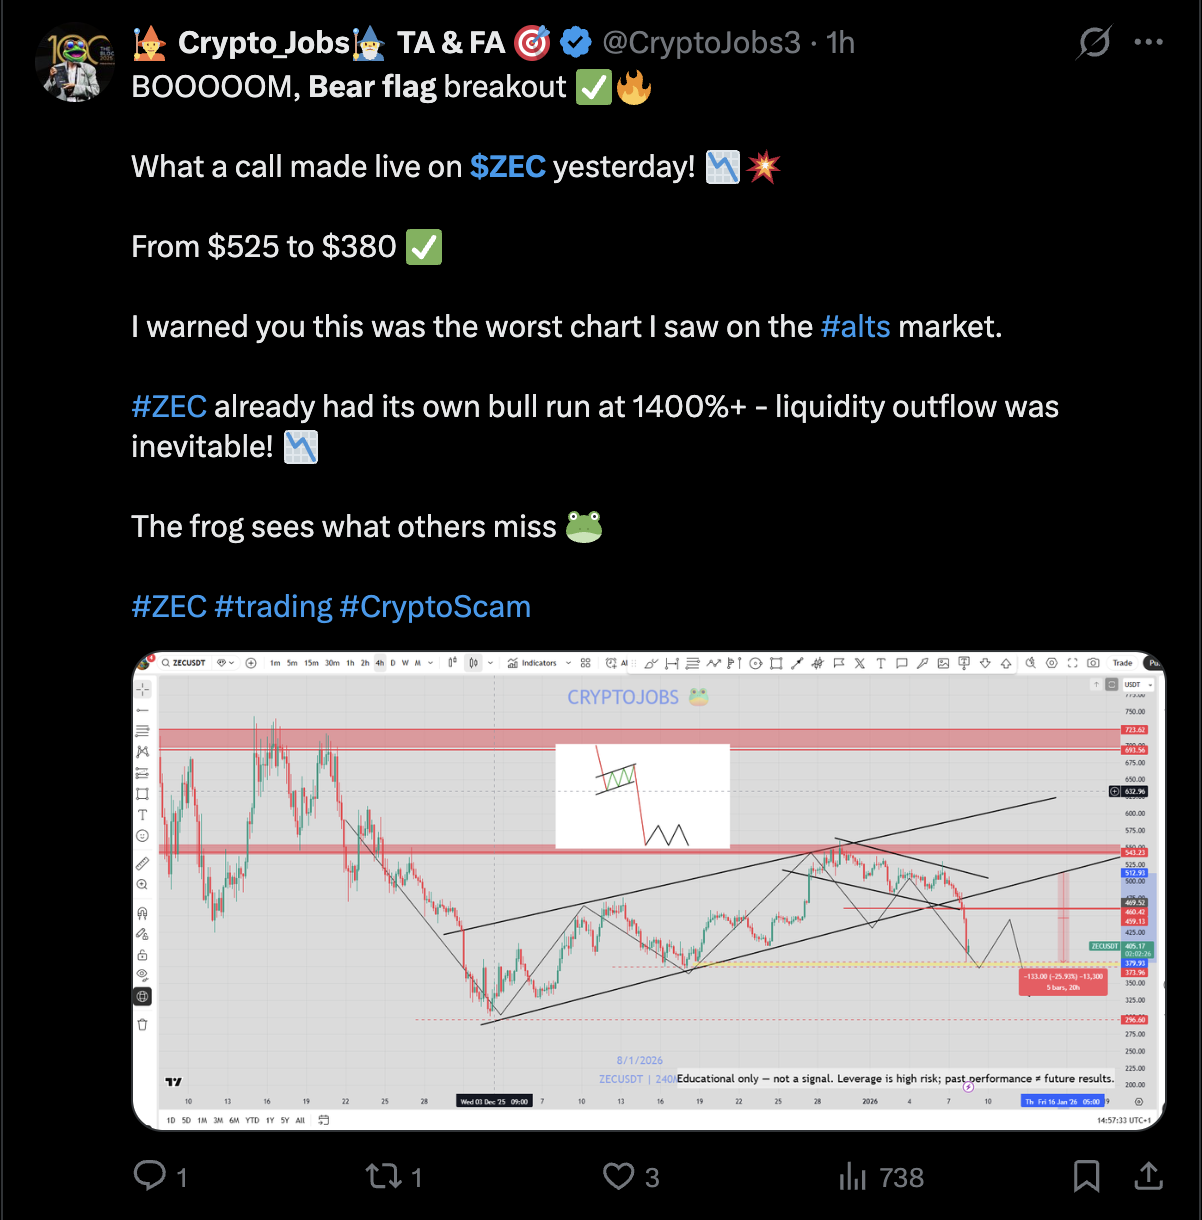
Zcash bear flag target: $275–$300
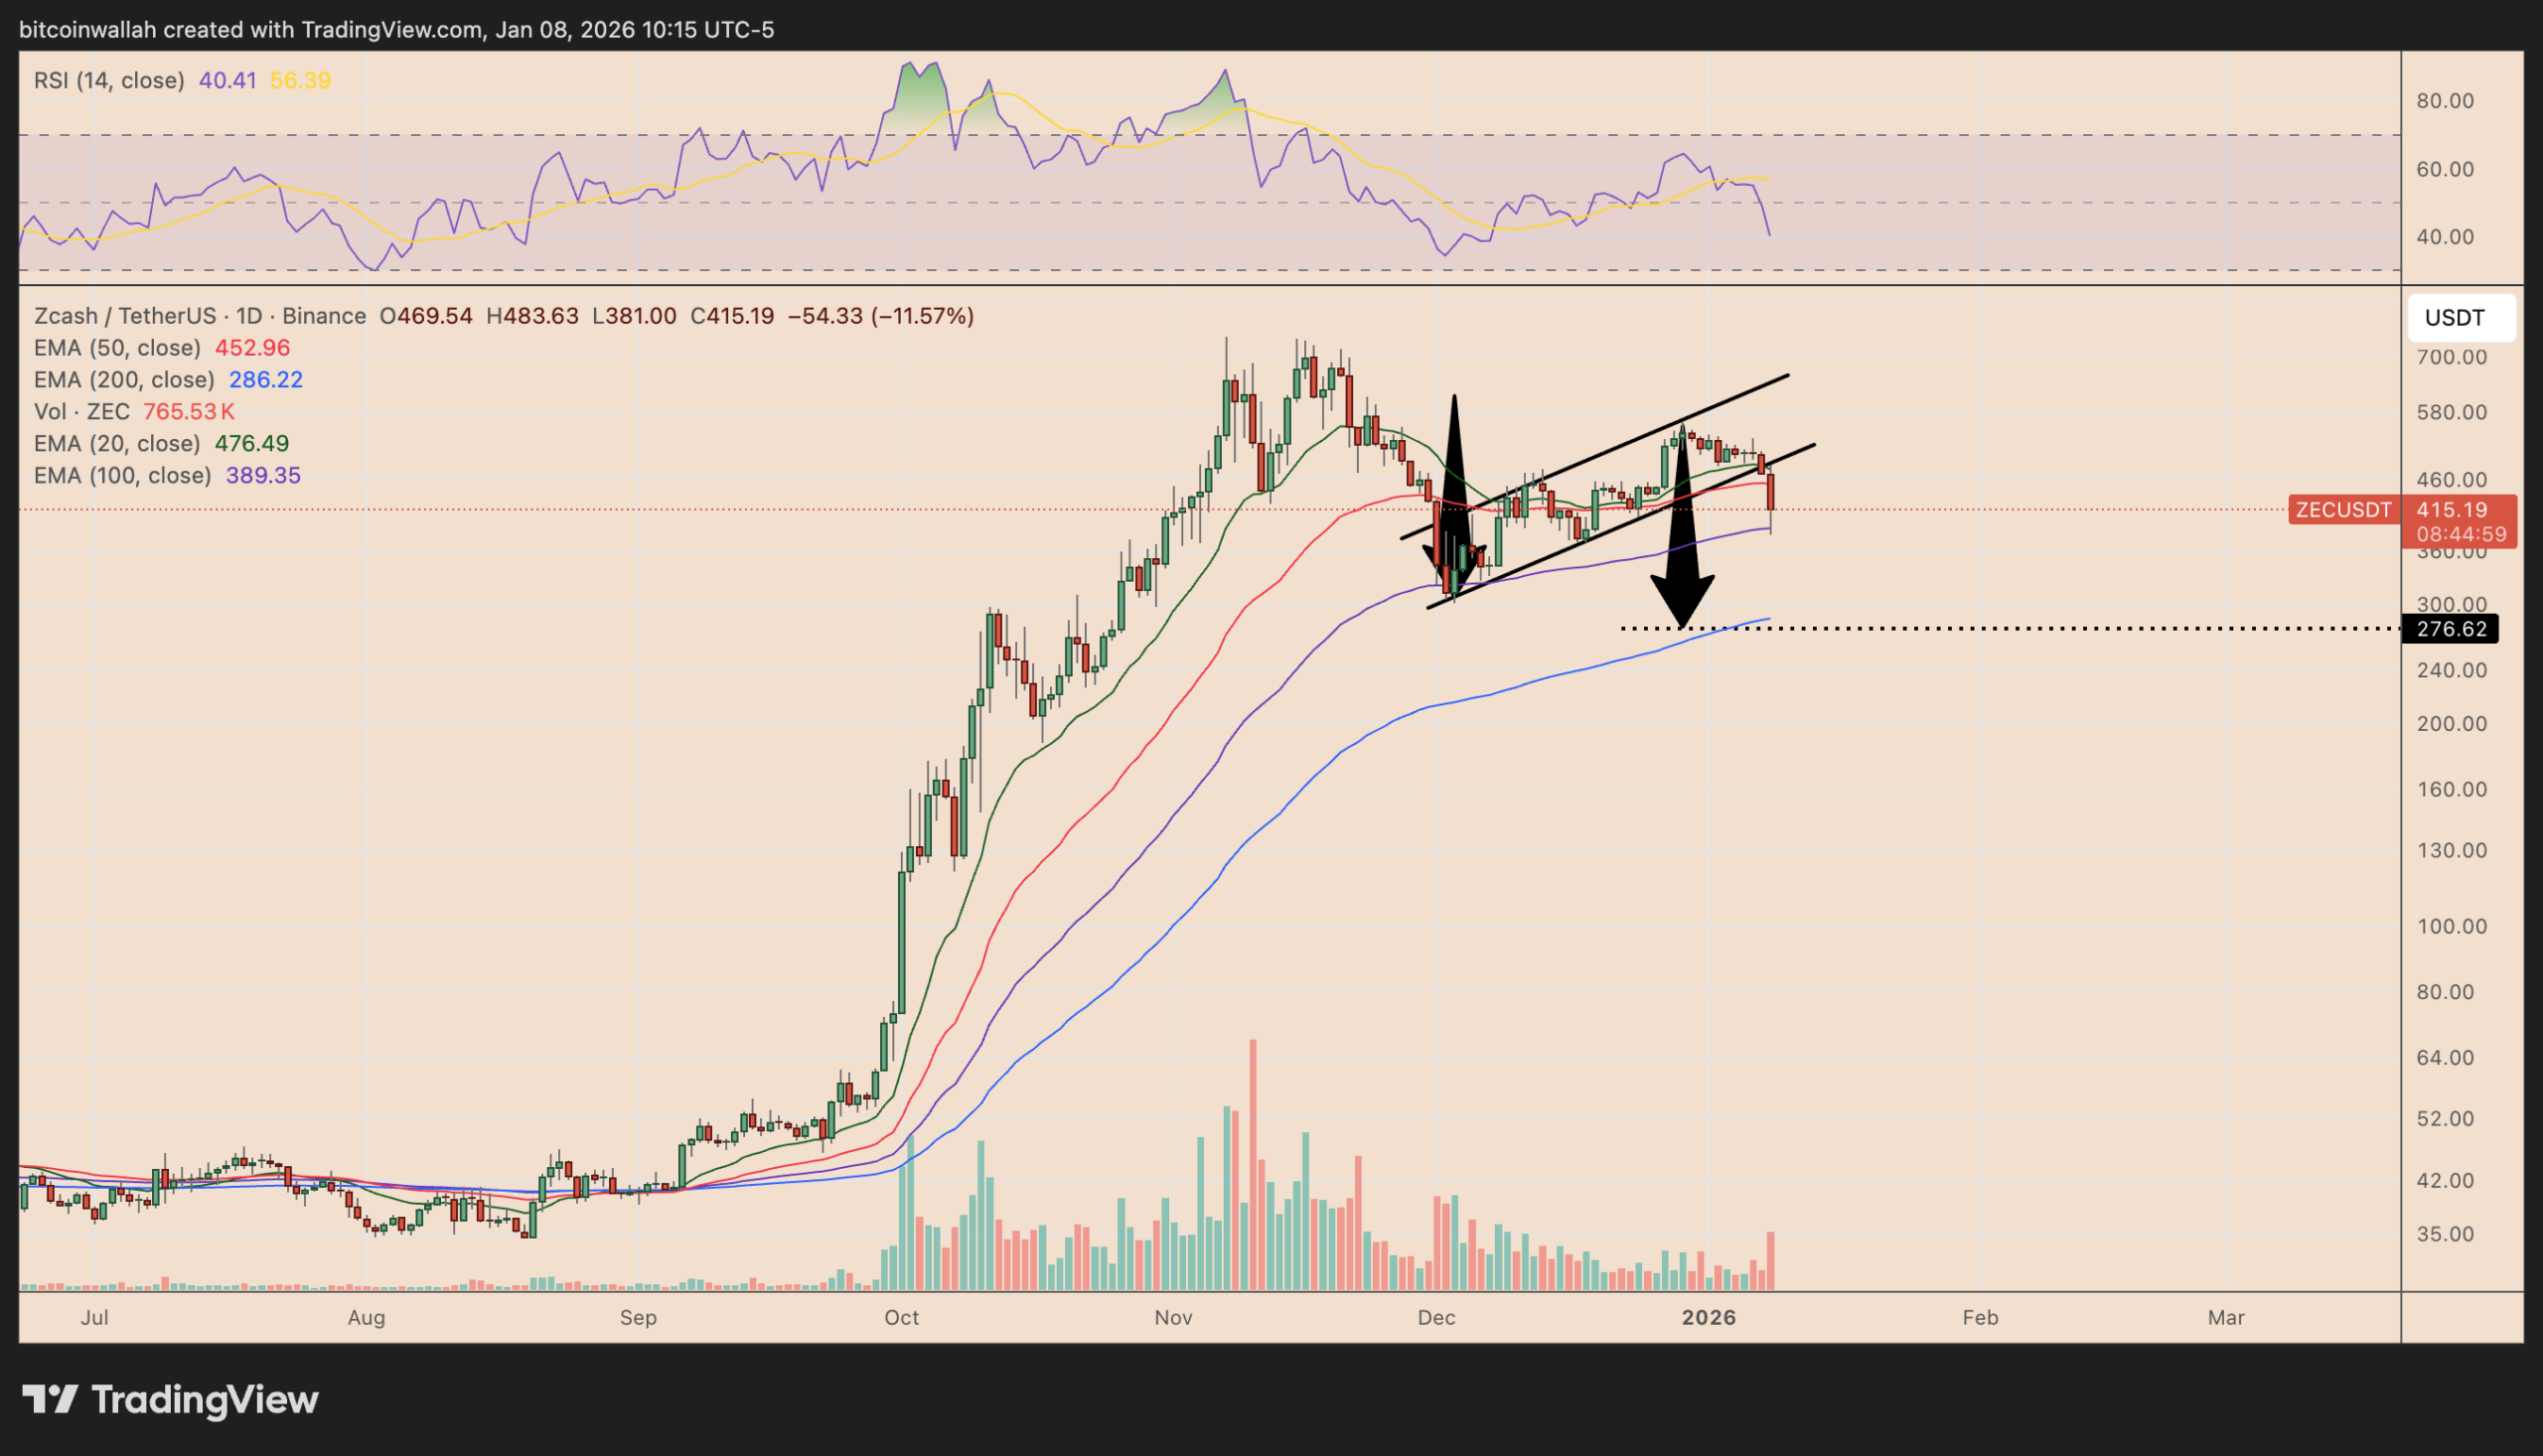
As of Thursday, Zcash was breaking out of its prevailing bear flag pattern, reinforcing the downside bias.
After its sharp sell-off from the $550–$580 region, ZEC entered a brief upward-sloping consolidation, capped by descending resistance, a typical bear flag pattern that often resolves lower.
The measured move pointed toward the $275–$300 zone if the pattern plays out fully. This target area aligned closely with the 200-day EMA (the blue wave), making it a likely downside magnet in the weeks ahead.
This article does not contain investment advice or recommendations. Every investment and trading move involves risk, and readers should conduct their own research when making a decision. While we strive to provide accurate and timely information, Cointelegraph does not guarantee the accuracy, completeness, or reliability of any information in this article. This article may contain forward-looking statements that are subject to risks and uncertainties. Cointelegraph will not be liable for any loss or damage arising from your reliance on this information.